In every geotechnical textbook, the friction angle of soil ($\phi$) is presented through the elegant geometry of the Mohr-Coulomb failure envelope. But as every field engineer knows, there is a vast gap between a circle on a graph and the messy reality of a borehole log. On-site, you aren’t just calculating a property; you are determining the safety of a retaining wall or the bearing capacity of a multi-story foundation.
The most reliable path for a geotechnical engineer is to derive this parameter directly or indirectly from laboratory and field tests, carefully analyzing the results to decide on the definitive value for each specific soil layer before inputting it into the analysis. While correlations are essential when data is limited or as a secondary check to verify the consistency of test results, the engineer’s judgment remains the primary anchor of the design. If test results show significant deviations from established correlations, it serves as a critical warning to reassess or repeat the testing process to ensure absolute structural safety.
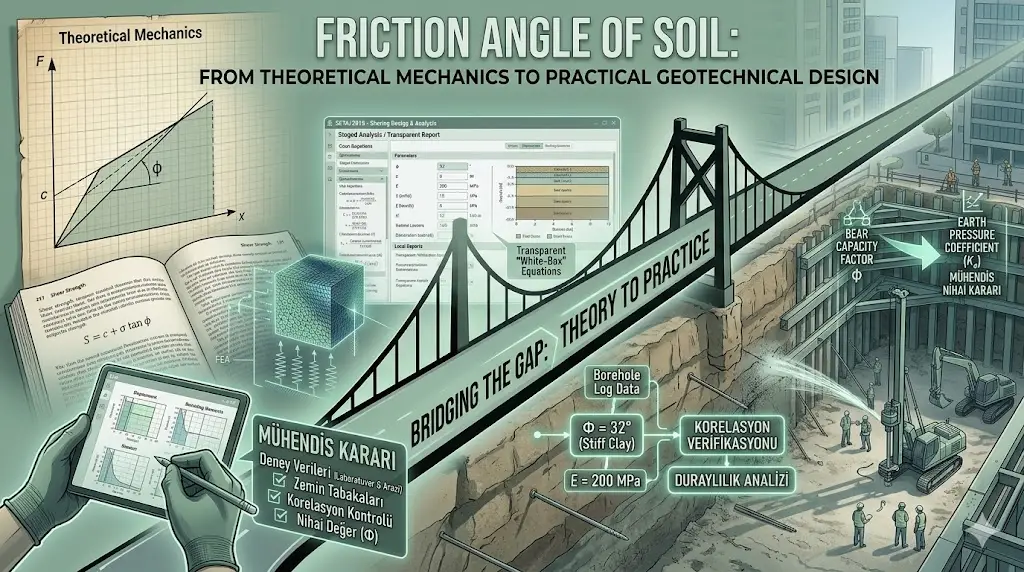
At SETAF2018, we began with a simple premise: geotechnical software should work the way engineers do—supporting the expert’s decision-making process. Our background is rooted in the “Setaf Know-How,” where we saw a need for a tool that bridges the gap between raw field data and professional, ready-to-submit design reports that reflect the engineer’s final verdict on soil parameters. In this guide, we’ll move past the abstract theory and focus on the practical methodologies used to define, verify, and apply the friction angle and other critical parameters like cohesion ($c$) and elasticity modulus ($E$) in modern projects.
What Does Friction Angle ($\phi$) Actually Represent?
At its core, the friction angle is a measure of a soil’s ability to resist shear stress. If you imagine sliding two blocks of sandpaper against each other, the resistance you feel is a macro-level version of what happens between soil grains. Physically, $\phi$ is governed by three primary factors:
- Particle Interlocking: In dense soils, grains are physically “locked” together. For the soil to shear, these particles must lift over one another (dilatancy), which requires extra force, leading to a higher friction angle.
- Angularity: Sharp, angular grains (like crushed rock) provide more resistance than smooth, rounded grains (like river sand). The jagged edges catch on each other, increasing the internal friction.
- Grain Size Distribution: Well-graded soils tend to have higher friction angles because smaller particles fill the voids between larger ones, creating a tighter matrix.
Beyond Theory: The Engineer’s Verdict
While these physical factors define the soil’s potential, the friction angle is not a “plug-and-play” value found in a textbook. For a professional geotechnical design, $\phi$—along with parameters like the elasticity modulus ($E$) and cohesion ($c$)—must be derived through direct laboratory testing or specialized field experiments. The engineer’s primary responsibility is to analyze these test results for each specific soil layer and decide on the most representative value for the analysis.
The Crucial Difference: Angle of Repose vs. Internal Friction Angle
It is a common mistake to use these terms interchangeably, but for a design engineer, the distinction is vital:
- Angle of Repose: This is the steepest angle at which a pile of loose, dry material remains stable without sliding. It essentially represents the friction angle in its loosest possible state at zero confining pressure.
- Internal Friction Angle ($\phi$): This is a measured engineering property that accounts for confining pressure and soil density. In a deep foundation or a braced excavation, the soil is “squeezed” by surrounding pressure, making its internal friction much higher than its simple angle of repose.
In practice, if laboratory data is insufficient, correlations are used as a secondary tool to verify these values. If the $\phi$ value obtained from a lab test deviates significantly from established empirical correlations, it acts as a red flag, prompting the engineer to either repeat the test or reassess the soil’s behavior to ensure project safety.
While advanced software like Plaxis (see our guide on [Plaxis Alternatives]) allows you to model these particles using complex finite element analysis (FEM) to see every minute deformation, most everyday geotechnical projects don’t require that level of overhead. For standard retaining walls or foundations, engineers need a way to translate these physical characteristics into design values quickly and accurately.
Determining the Friction Angle: Field vs. Lab
In a perfect world, every project would have a budget for high-quality undisturbed sampling and extensive laboratory testing. In the real world, engineers must balance precision with project timelines and budgets.
Laboratory Testing: The Gold Standard
To measure the friction angle directly, two tests are typically used:
- Direct Shear Test: Best for sands and gravels to determine the drained friction angle.
- Triaxial Shear Test: Offers more control over drainage and pore pressure, providing a more comprehensive understanding of soil behavior under different loading conditions.
While lab tests provide direct data, they are time-consuming and expensive. For the majority of urban development and infrastructure projects, engineers turn to field-based estimations.
Field Correlations: The Practical Reality
Most geotechnical designs today are built on the back of the Standard Penetration Test (SPT). Because the SPT N-value is a measure of the soil’s resistance to penetration, it correlates directly with the density and, by extension, the friction angle of granular soils.
However, not all correlations are created equal. Depending on the soil type (fine vs. coarse sand) and the overburden pressure, the formula you choose matters.
Common Empirical Formulas
Experienced engineers rely on a few established correlations to derive $\phi$ from corrected N-values:
- Hatakanda and Uchida (1996):
phi = 3.5 * (N)^0.5 + 22.3
(Note: This is widely used for medium to coarse sands but may require adjustments for fine sands.) - Peck, Hanson, and Thorburn:
This approach uses a graphical correlation or tabular data to relate N-values directly to the bearing capacity factors and the friction angle. - Wolff Correlation: Often used for sands, following the form: phi = 27.1 + 0.3 * N – 0.00054 * N^2.
If you find that the complexity of high-end modeling software like Midas (check out our guide on [Midas Alternatives]) makes these simple correlation tasks feel like an administrative burden, you aren’t alone. Many practitioners find that for the 90% of projects that rely on these standard correlations, a more streamlined, specialized tool is far more efficient than a multi-purpose finite element suite.
Automating Soil Correlations with SETAF2018
Calculating the friction angle manually for every borehole and every soil layer is not just tedious; it is prone to human error. In a typical project with multiple soil strata, keeping track of different correction factors and empirical formulas can lead to inconsistencies in your final design.
SETAF2018 was designed to solve this administrative burden by automating the correlation process directly within the software environment (as detailed in Section 2.4 of our technical documentation).
Transparent Reporting: No More “Black-Box” Calculations
One of the biggest frustrations with high-end geotechnical software is the lack of transparency. Often, you plug in a value and get a result without knowing exactly how the software got there.
SETAF2018 takes a different approach. Our “Open Equation” reporting system ensures that:
- Every correlation used (whether it’s Wolff, Peck, or Hatakanda & Uchida) is printed explicitly in the final report.
- You can audit the math step-by-step, ensuring full compliance with local regulations and providing peace of mind during municipal or peer reviews.
An Integrated Design Workflow
In SETAF2018, the friction angle isn’t just a static number in a table. It is a dynamic part of your design chain:
- Input: Enter your raw SPT N-values into the borehole module.
- Correlate: Select your preferred empirical formula within the Soil Material tab.
- Analyze: The derived friction angle flows automatically into the Retaining Wall, Shoring, or Foundation modules.
By centralizing the correlation and design phases into a single file structure, you eliminate the risk of data entry errors between different spreadsheets and design programs.
Ready to see how SETAF2018 simplifies your parameter analysis? [Start your Free Trial of SETAF2018 today] and experience a more transparent way to handle soil mechanics.
How Friction Angle Impacts Your Structure
In geotechnical engineering, the friction angle is the primary “lever” that controls the magnitude of soil forces. A small variation in $\phi$ can lead to a massive change in the required thickness of a concrete wall or the depth of a foundation pile.
Retaining Walls: The Battle of Earth Pressures
The friction angle directly dictates the lateral earth pressure coefficients. Whether you are using Rankine or Coulomb theory, $\phi$ is the decisive factor:
- Active Pressure ($K_a$): As the friction angle increases, $K_a$ decreases. This means a “stronger” soil with higher internal friction exerts less pressure on the back of your wall, allowing for more economical designs.
- Passive Pressure ($K_p$): Conversely, $K_p$ increases dramatically with $\phi$. This is crucial for the stability of embedded structures and sheet pile walls that rely on the soil in front of the wall for resistance.
Foundation Bearing Capacity: The 2-Degree Difference
The impact of $\phi$ is most visible in bearing capacity equations (like Terzaghi or Meyerhof). The bearing capacity factors ($N_c, N_q, N_{\gamma}$) are exponential functions of the friction angle.
Consider this: In many soil types, a mere 2-degree increase in the friction angle (e.g., from 30° to 32°) can result in a 20-30% increase in ultimate bearing capacity. This difference could be the deciding factor between choosing a cost-effective shallow foundation or being forced into an expensive deep pile foundation.
While modular software like Geo5 (see our comparison of [Geo5 Alternatives]) provides separate tools for these calculations, the risk of data fragmentation is real. Having to manually export the friction angle from a correlation module and import it into a foundation module creates “friction” in your own workflow.
SETAF2018 eliminates this by keeping your soil parameters and structural analysis in a single, unified file structure. When you update the SPT N-value in your borehole log, every dependent $K_a$ and bearing capacity calculation updates instantly.
Choosing the Right Geotechnical Software for Parameter Analysis
When selecting a tool for soil parameter analysis and structural design, it is easy to be overwhelmed by high-end suites that offer complex constitutive models and multi-dimensional finite element analysis. However, experienced project managers often follow the “90/10 Rule” of geotechnical engineering to maintain both technical accuracy and operational efficiency.
The 90/10 Rule: Efficiency vs. Complexity
- The 90%: Most professional projects—residential buildings, standard retaining walls, and routine slope stability assessments—are “standard” structures. They rely on classical engineering methods and established empirical correlations. For these, the steep learning curve and high cost of advanced Finite Element Method (FEM) software are often overkill.
- The 10%: Only a small fraction of projects, such as skyscrapers on liquefiable soil or complex deep-sea tunnels, truly require the intensive computational power of specialized FEM suites.
Using a high-end FEM tool for a standard project is like using a flight simulator to plan a drive across town; it’s not just unnecessary—it’s a drain on your billable hours.
Finding Your Fit
The goal is to choose a tool that matches the rhythm of your office. You need a software that allows you to move from borehole data to a signed-off report in hours, not days.
If you want to see how different platforms compare in terms of depth, speed, and reporting capabilities, check out our comprehensive guide on the [Top Geotechnical Softwares]. Understanding where specialized tools like SETAF fit into your workflow compared to generalist suites can significantly improve your firm’s project turnaround time.
Conclusion: Consistency is Key
In geotechnical engineering, the friction angle of soil is more than just a numerical input; it is a representation of the earth’s strength and the primary guardian of your structure’s stability. Whether you derive it from a complex triaxial test or a standard SPT correlation, your design is only as reliable as the parameters you choose.
As we have explored, a minor variance in $\phi$ can ripple through your entire project—altering lateral pressures, foundation sizes, and ultimately, project costs. This is why consistency and transparency are not just “best practices” but professional necessities.
Building Trust Through Transparency
At the end of the day, your role as an engineer is to provide safety and certainty. When you submit a report to a client or a municipality, you aren’t just giving them a result; you are providing a justification.
Using tools that show your work—listing every equation, every correlation, and every correction factor—builds a level of trust that “black-box” software simply cannot match. By automating the tedious parts of soil mechanics with SETAF2018, you ensure that your focus remains on high-level engineering decisions while the software handles the rigorous documentation required for modern compliance.
Don’t let your project’s safety be hidden behind opaque calculations. Embrace a workflow where the physics of the soil meets the precision of professional reporting.
Frequently Asked Questions (FAQ)
1. How do I choose between different SPT to Friction Angle correlations?
The choice depends on the soil’s grain size and the specific engineering standards of your region. For instance, Hatakanda and Uchida is often preferred for gravelly sands, while Peck or Wolff might be more suitable for fine-to-medium sands. SETAF2018 allows you to toggle between these established methods in the Soil Material tab, helping you compare results instantly.
2. Is the Angle of Repose the same as the Internal Friction Angle?
Not exactly. The angle of repose refers to the stability of a loose, unconfined pile of soil. The internal friction angle is an inherent shear strength parameter used in design, often measured under confining pressure. While they can be similar for dry, loose sands, the internal friction angle is what you must use for professional geotechnical calculations.
3. Can I use the friction angle to calculate both active and passive earth pressures?
Yes. The friction angle ($\phi$) is the primary input for determining the coefficients of lateral earth pressure ($K_a$ and $K_p$). In SETAF, once you define your soil layers’ friction angles through correlations or lab data, the software automatically applies these to your retaining wall or shoring analysis.
4. Why does SETAF show the equations in the reports?
In geotechnical engineering, “transparency is safety.” Most high-end software acts as a “black box,” making it hard to verify calculations. We believe engineers should be able to audit every step of their design. SETAF’s reports explicitly list the formulas used, such as $Ka = tan^2(45 – \phi/2)$, ensuring your work is defensible during peer reviews.
5. What is a “typical” friction angle for sand?
Typically, loose sands range from 28° to 30°, medium-dense sands from 32° to 36°, and very dense sands can exceed 40°. However, these are generalities; always use site-specific SPT data or lab tests for final designs.