SETAF2018: Integrated Geotechnical Analyses and Graphical Modeling
Manage the entire process on a single platform, from soil profiling to the most complex retaining structure and slope stability analyses. SETAF2018 transforms your raw data into instant graphs and reportable engineering outputs.
In geotechnical design, accuracy begins with proper data visualization. SETAF2018 automatically graphs borehole data and SPT/CPT results, allowing you to use this data simultaneously in all your analyses.
1. Dynamic Soil Profile and Graphical Data Management
Manage soil data, the foundation of your analyses, with professional graphs and dynamic diagrams, freeing yourself from manual calculation burdens.
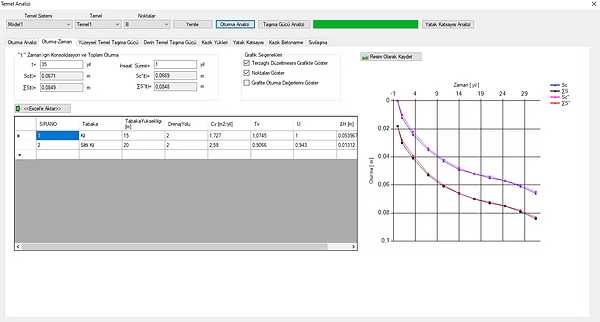
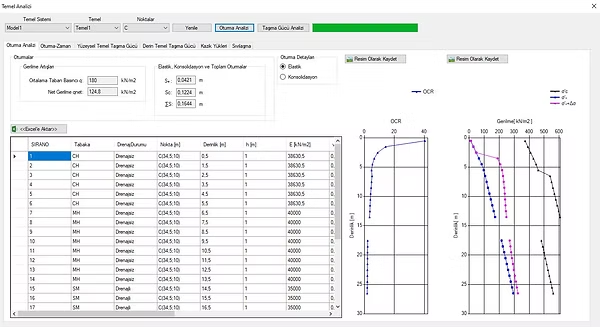
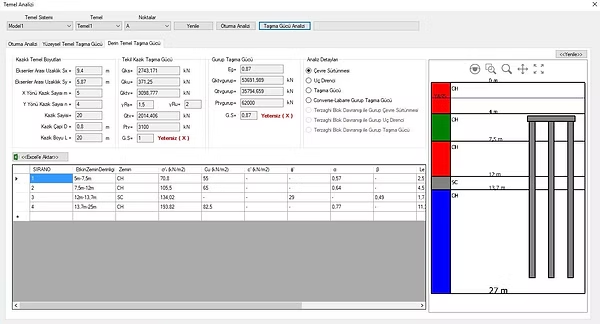
2. Advanced Foundation and Settlement Analyses
Model load transfer and settlement behavior in shallow and pile foundations using the most precise numerical methods. Base your design on scientific data to construct safe structures.
3. TBDY 2018 Liquefaction and Ground Improvement Design
Analyze soil behavior under earthquake effects according to current regulations and develop improvement strategies. Manage liquefaction risk with scientific methods.
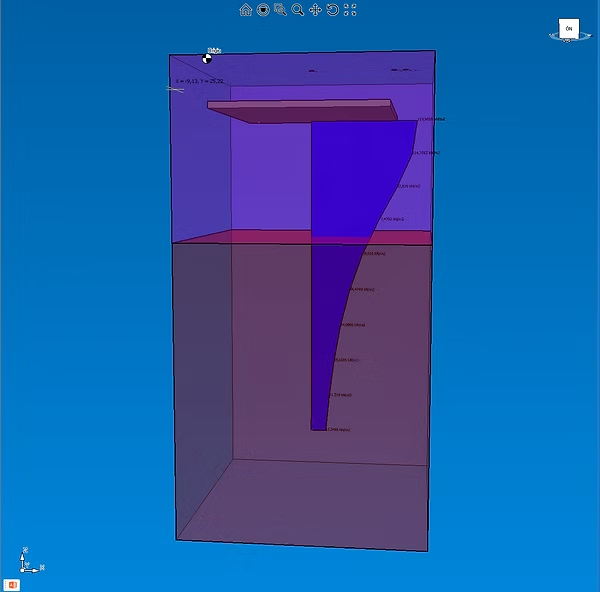
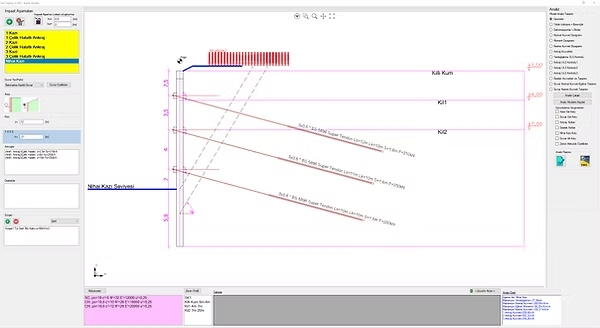
4. Support Systems and Phased Construction Simulation
Create realistic retaining structure designs with the Coupled Pressures Method. Simulate wall-soil interaction and construction stages step-by-step with Winkler spring assumption.
The safety of slopes and embankments is measured by the accurate detection of the most critical slip surface. SETAF2018 minimizes the risk of overall failure by simulating the riskiest scenarios in seconds with Limit Equilibrium Methods.
5. Slope Stability and Slip Surface Optimization
Test slope safety with Bishop and Fellenius slice methods. Find the most critical slip surface in seconds with automatic search algorithms.