A contour map plotter is a tool or method used to convert spatially distributed data points into contour lines that connect locations with equal values. At its simplest, the process can be represented as:
X Coordinate + Y Coordinate + Measured/Defined Value → Contour Map
The plotted value may represent ground elevation or another parameter that varies spatially across a site. By converting individual observations into contour lines, engineers can more easily identify spatial patterns, gradients, and changes across the investigated area.
In geotechnical engineering, this is particularly useful because ground information is typically collected at discrete investigation locations, such as boreholes, rather than continuously across the entire site. Contour visualization can therefore help engineers interpret how a surface or selected property may vary between these known locations.
However, a contour map represents an interpretation between known data points; it does not create new measured ground data. The process used to estimate values between those observations is known as interpolation, and understanding it is essential for interpreting contour maps correctly.
What Is a Contour Map Plotter?
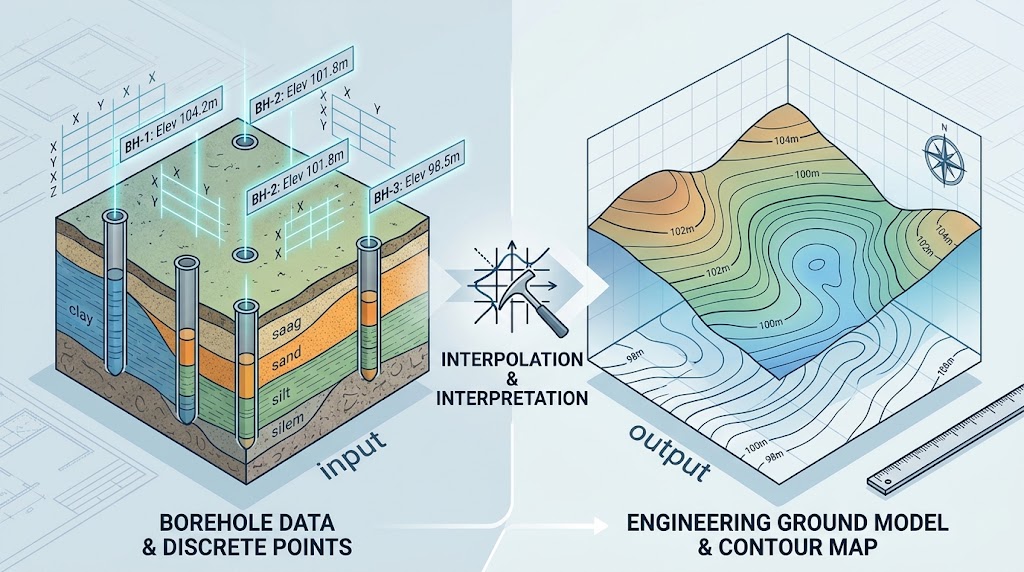
A contour map plotter transforms discrete spatial observations into a continuous visual representation of how a measured or defined value varies across an area. Each input point typically contains three components: an X coordinate, a Y coordinate, and a Z/value representing the parameter to be mapped.
For example, borehole ground elevations might be recorded as:
| Point | X | Y | Elevation |
| BH-1 | 10 | 20 | 104.2 m |
| BH-2 | 50 | 25 | 101.8 m |
| BH-3 | 35 | 60 | 98.5 m |
Because measurements exist only at these locations, the plotter uses interpolation to estimate how values may vary between the known points. It then generates contour lines connecting locations with the same interpreted value. The contour interval determines the difference in value between successive lines—for example, elevation contours at 1 m intervals.
The same principle can be applied to different spatially distributed parameters, provided contour representation is appropriate for the dataset.
The distinction between input and output is important: data points are known input information, while the resulting contour surface is an interpreted spatial representation. Its reliability therefore depends on the quantity, distribution, and quality of the original observations, as well as the interpolation method used.
How Does a Contour Map Plotter Work?
A contour map plotter converts discrete observations into a continuous visual representation through a sequence of data definition, interpolation, and contour generation. The workflow is largely the same whether the mapped variable is ground elevation or another spatially distributed engineering parameter.
Step 1 – Define the Data Points
Each observation requires a spatial location and the value to be plotted:
X + Y + Value
For a topographic contour map, this becomes:
X Coordinate + Y Coordinate + Elevation
For other engineering datasets, the third value can represent another spatial variable where contour mapping provides a meaningful representation. The quality and distribution of these input points directly influence the resulting map.
Step 2 – Interpolate Between Known Points
Measurements usually exist only at specific locations. Interpolation estimates values in the spaces between those known observations using the selected mathematical approach. This allows discrete points to be represented as an apparently continuous surface.
The estimated values remain interpretations rather than additional measurements.
Step 3 – Generate the Contour Lines
The interpolated surface can then be divided into isolines, with each contour connecting locations assigned the same value.
For example, a 100 m elevation contour connects all interpreted locations where the ground surface elevation equals 100 m.
Step 4 – Select an Appropriate Contour Interval
The contour interval defines the difference between successive contour values. Smaller intervals display changes in greater visual detail, while larger intervals provide a more generalized representation.
However, increasing the number of contour lines does not increase the amount or accuracy of the underlying field data. The contour interval should therefore reflect the quality, density, and purpose of the available dataset, rather than simply producing a more detailed-looking map.
How to Read a Contour Map
Reading a contour map involves looking at both the values assigned to individual contour lines and the way those lines are distributed across the mapped area. Each line represents a constant contour value, while the contour interval defines the numerical difference between consecutive lines.
The spacing between contours provides information about how rapidly the mapped value changes spatially. For a topographic or elevation contour map:
Closely spaced contours → steeper change in elevation
Widely spaced contours → gentler change in elevation
Contour patterns can also reveal high and low areas, gradients, and broader spatial trends. Closed contours with increasing values toward the center, for example, may indicate a local high point, while decreasing values may indicate a depression, depending on the dataset and mapping conventions.
However, contour spacing must always be interpreted according to the parameter being plotted. When the contours represent ground elevation, their spacing relates directly to changes in topography. When they represent another engineering parameter, closely spaced lines indicate a faster spatial change in that particular value, not necessarily a steep ground surface.
This distinction is especially important in engineering applications. A strong gradient in a contoured soil or groundwater parameter should not automatically be interpreted as a topographic feature. Contour values, intervals, spacing, and spatial patterns must always be evaluated in the context of the underlying dataset.
Contour Maps vs 3D Surface Models
A contour map and a 3D surface model can represent the same spatial dataset in different ways. A contour map presents variation in two dimensions using lines that connect locations with equal values, while a 3D surface model represents those variations as a continuous three-dimensional surface.
For example, a dataset containing borehole locations and ground elevations can potentially move through the following visualization workflow:
Borehole Coordinates + Ground Elevations → Data Points → Contour Map → Interpolated Surface → 3D Visualization
Contour maps are particularly useful because they are compact and easy to interpret numerically. Engineers can identify specific values, gradients, and spatial patterns while maintaining a conventional plan view, making contour maps practical for engineering drawings, plans, and reports.
A 3D surface model, by contrast, can make spatial relationships and changes in geometry easier to understand visually. This can be particularly valuable when interpreting irregular surfaces, comparing elevations across a site, or communicating complex ground geometry.
However, neither representation improves the quality of the underlying investigation data. A detailed 3D model is not inherently more accurate than a contour map created from the same observations. In both cases, reliability ultimately depends on the quality, density, spatial distribution, and interpretation of the original data points.
Why Interpolation Matters in Contour Mapping
Engineering investigation data is inherently discrete. Measurements are collected at specific coordinates, boreholes, test locations, or survey points, while a contour map presents the resulting information as though values vary continuously across the entire mapped area. The transition between these two forms of information requires interpolation:
Measured Point A → Unknown Space → Measured Point B
Interpolation estimates the values that may occur within this unknown space based on the available observations and the assumptions of the selected interpolation method.
The reliability of that interpretation depends on several factors. The distance between data points and the overall density of observations determine how much information is available to constrain the estimated surface. Their spatial distribution also matters: numerous points concentrated in one part of a site may provide little confidence elsewhere. Local variability, boundary conditions, and interpolation assumptions can further influence the resulting contour geometry.
Most importantly, interpolation estimates what may occur between known observations; it does not convert an uninvestigated location into a measured one.
This distinction becomes particularly important when data is sparse. A contour plotter can still generate smooth, detailed, and visually convincing contours from a limited dataset, even though the areas between observations remain poorly constrained.
For engineering interpretation, visual detail should therefore never be confused with data quality. More detailed visualization ≠ greater geological certainty. Contours should always be evaluated against the density and distribution of the underlying investigation data and the engineering assumptions used to connect those observations.
Contour Maps in Geotechnical Engineering
Geotechnical engineering is inherently spatial because ground conditions can vary both horizontally across a site and vertically with depth. Site investigations capture this variability through discrete observations rather than continuous measurements. These may include boreholes, sampling locations, field tests, groundwater observations, and survey coordinates, each providing information about conditions at a specific location.
Contour mapping can help engineers visualize spatial trends within this investigation data where the quantity, distribution, and engineering interpretation of the available observations justify interpolation. For example, contours may be useful for representing ground surface elevations or selected spatially distributed ground and investigation information across a project area.
However, not every geotechnical parameter should automatically be converted into a contour map. The engineering meaning of the parameter, variability of the ground, spacing of investigation points, and reliability of interpolation must all be considered before treating a contoured surface as useful.
A geotechnical contour map should therefore be interpreted alongside the broader site investigation, including borehole locations, stratigraphy, geological interpretation, groundwater conditions, field and laboratory test results, and site geometry. A contour pattern that appears reasonable mathematically may still require revision when compared with the actual geological and geotechnical evidence.
For this reason, contour mapping is most useful as part of a wider interpretation process. A contour map becomes considerably more valuable when it contributes to a consistent ground model rather than existing as an isolated graphic or visualization.
From Borehole Data to a Geotechnical Contour Map
Creating a geotechnical contour map begins with site investigation data collected at known locations. The objective is not simply to connect borehole values mathematically, but to interpret how observed ground conditions may vary across the project site.
A typical workflow can be represented as:
Site Investigation → Boreholes → Coordinates & Elevations → Soil Data → Spatial Interpretation → Contours
Borehole Locations Define Known Observation Points
Each borehole represents a discrete observation location with defined X/Y coordinates and ground elevation. Within the borehole, soil conditions are recorded at specific depths or elevations through stratigraphic logging, sampling, and field or laboratory testing.
These observations provide known information at the borehole location, but they do not directly measure conditions throughout the space between boreholes.
Soil Boundaries Vary Between Boreholes
Consider a soil layer encountered in two boreholes. BH-1 may identify the top of the layer at one elevation, while BH-2 encounters the same interpreted layer at a different elevation. Determining how that boundary changes between and around the boreholes requires geological and geotechnical interpretation.
The same principle applies when additional investigation points are incorporated across the site.
Contours Help Visualize Spatial Variation
Once corresponding observations have been interpreted, contour lines can provide a plan-view representation of their estimated spatial variation. This can make changes in surfaces or other appropriate geotechnical data easier to recognize across the project area.
However, the workflow should never be understood as boreholes automatically revealing the complete geology between them. The more appropriate relationship is:
Boreholes → Engineering Interpretation → Ground Model
Contour mapping is therefore a visualization of the interpreted ground model, with its reliability ultimately constrained by the underlying investigation data and engineering judgment.
What Geotechnical Data Can Be Visualized With Contours?
Contour mapping can be applied to different types of spatially distributed geotechnical data, provided that the parameter has a meaningful relationship with location and that the available observations are sufficient to support interpolation. The purpose is not simply to create a continuous-looking surface, but to make relevant spatial trends easier to interpret.
Potential applications can include ground surface elevations, interpreted soil layer or interface elevations, groundwater levels where appropriate, investigation-derived spatial values, and selected engineering results for which a plan-view distribution provides useful information.
However, not every geotechnical parameter should be interpolated simply because software is capable of generating contours. Some properties may vary abruptly between investigation points, depend strongly on soil type or depth, or lack enough observations to justify a continuous spatial representation. In these situations, a smooth contour map could imply a level of continuity or certainty that the investigation data does not support.
Before creating a geotechnical contour map, engineers should therefore ask four questions:
- Is the parameter spatially meaningful?
- Is there enough investigation data to identify a credible trend?
- Is interpolation between the available observations reasonable?
- Does the resulting contour help answer the engineering question?
Contour visualization should ultimately serve the engineering interpretation of the site. The ability to generate a contour is not, by itself, evidence that the underlying parameter should be represented as a continuous surface.
Contour Maps Are Not the Same as Soil Profiles
A contour map, soil profile, and 3D ground model represent ground conditions from different perspectives. Although they may use information from the same site investigation, they serve different purposes in geotechnical interpretation.
Contour Map → Plan View
Soil Profile → Section View
3D Ground Model → Spatial Ground Representation
A contour map shows how an elevation, surface, or other appropriate parameter varies horizontally across the site. It is particularly useful for identifying spatial trends and understanding how interpreted values change between investigation locations in plan view.
A soil profile or cross-section, by contrast, represents ground conditions vertically along a selected alignment. It can show boreholes, layer boundaries, stratigraphy, groundwater conditions, and other relevant information with depth.
A 3D ground model brings horizontal and vertical information together, allowing engineers to understand the spatial relationships between boreholes, ground surfaces, and interpreted subsurface layers across the project area.
Geotechnical engineers often need all three perspectives because no single visualization provides a complete representation of variable ground conditions. A contour map may reveal horizontal trends while a cross-section explains vertical stratigraphy, and a 3D model helps connect both spatially.
This is why contour plotting becomes considerably more useful when connected with borehole data and stratigraphic modeling, rather than being treated as a standalone visualization.
From Contour Visualization to a Usable Ground Model
A standalone contour plot primarily answers one spatial question:
How does this value appear to vary across the site?
A geotechnical ground model must answer a broader engineering question:
What ground conditions are present, where are they located, and how will they affect the engineering problem?
Moving from visualization to engineering therefore requires more than interpolating values between investigation points. A typical workflow can be represented as:
Boreholes → Stratigraphy → Spatial Interpretation → Ground Model → Foundation / Excavation / Slope → Analysis
When borehole data, contour plots, soil profiles, and engineering parameters are maintained in separate spreadsheets or exported between disconnected tools, relationships between the original investigation data and the resulting engineering model can become difficult to track. A contour may show an interpreted surface clearly, for example, while providing little context about the soil layers, groundwater conditions, or engineering parameters associated with that surface.
The engineering value of contour mapping is therefore not simply the production of a visually detailed map. Its value comes from connecting spatial interpretation with the ground conditions used in subsequent calculations.
An integrated ground model preserves that connection. Borehole observations inform stratigraphy, stratigraphy supports spatial interpretation, and the resulting model provides ground conditions for evaluating foundations, excavation support systems, slopes, and other geotechnical problems. In this workflow, contour visualization becomes one component of the engineering model rather than the final objective.
Geotechnical Data Visualization and Ground Modeling in SETAF2018
Geotechnical visualization is most useful when it remains connected to the investigation data and engineering model behind it. Rather than treating boreholes, soil profiles, and spatial representations as separate outputs, an integrated workflow allows engineers to interpret ground conditions within the context of the complete project.
Model Multiple Boreholes Within the Project Site
SETAF2018 allows multiple boreholes to be defined within a project and their profiles to be modeled together with the ground surface in a 3D project environment. This provides flexibility when developing and reviewing idealized soil profiles across a site.
The software does not eliminate the need for geological or geotechnical interpretation between investigation points. Instead, it provides an environment in which borehole information can be organized, visualized, and interpreted as part of the ground model.
Connect Spatial Data With Soil Profiles
Keeping borehole locations, ground elevations, stratigraphy, groundwater conditions, and soil properties within the same project model helps preserve the relationship between spatial information and the subsurface conditions it represents.
This is more useful for geotechnical engineering than treating contour generation as an isolated visualization task. Engineers can evaluate spatial relationships while retaining the vertical and material context provided by boreholes and soil profiles.
Move From Visualization to Engineering Analysis
The SETAF2018 workflow can continue beyond ground visualization. Once ground conditions and engineering parameters have been defined, the project environment can support analyses and design workflows involving shallow foundations, piles and micropiles, ground improvement systems, excavation support, retaining structures, and slope stability, depending on the engineering problem.
This creates a broader workflow:
Investigation Data → Ground Model → Engineering System → Analysis → Design
The objective is not simply to plot the ground, but to build a ground representation that can support engineering decisions.
Common Mistakes When Creating Geotechnical Contour Maps
A geotechnical contour map can provide a clear representation of spatial variation, but the quality of the visualization should not be confused with the reliability of the underlying ground interpretation. Several common mistakes can lead to misleading conclusions.
1. Treating Interpolated Values as Measured Data
Values between boreholes or investigation points are estimated through interpolation, not measured directly. They should therefore be interpreted with an appropriate level of uncertainty.
2. Using Too Few Data Points
Contour software can generate a smooth surface even from a sparse dataset. However, a visually continuous map may still be poorly constrained by actual site investigation data, particularly where distances between observations are large.
3. Choosing an Unrealistically Small Contour Interval
Smaller contour intervals create more detailed-looking maps, but they do not increase data accuracy. Visual precision should not exceed the resolution and quality of the underlying observations.
4. Ignoring Geological and Stratigraphic Context
Mathematical interpolation alone cannot determine subsurface geology. Layer continuity, geological boundaries, stratigraphic changes, and field observations should influence how spatial trends are interpreted.
5. Treating the Contour Map as the Complete Ground Model
A contour map typically visualizes one spatial relationship. Engineering assessment requires a much broader representation:
Stratigraphy + Groundwater + Properties + Geometry + Loads
Contours should therefore support the ground model rather than replace it. Ultimately, the quality of a contour map depends more on the quality and interpretation of its input data than on how detailed the finished plot appears.
Conclusion: A Contour Plot Is Only as Useful as the Ground Model Behind It
A contour map plotter provides an effective way to transform discrete spatial observations into a representation that makes patterns, gradients, and variations easier to understand. At its simplest, the process follows:
X + Y + Value → Interpolation → Contour Lines
In geotechnical engineering, however, the workflow extends beyond visualization:
Investigation → Boreholes → Ground Interpretation → Spatial Model → Engineering Analysis
Contour maps can help engineers understand how an interpreted surface or parameter may vary across a site, but the distinction between observation and interpretation must remain clear. Visualization ≠ Measurement, and Interpolation ≠ Ground Investigation. A detailed contour surface cannot compensate for insufficient investigation data or uncertainty in the geological interpretation.
The strongest engineering use of contour mapping therefore occurs when the visualization remains connected to its source data and the broader ground model.
SETAF2018 extends this workflow by allowing borehole, soil-profile, and engineering information to be handled within an integrated geotechnical project environment, helping engineers move from ground representation toward analysis, design, and documentation.
FAQ
What is a contour map plotter?
A contour map plotter is a tool or method that converts discrete spatial data points into lines representing locations with equal values. The input data typically consists of X and Y coordinates plus a measured or defined value. Because observations are available only at specific locations, interpolation is used to estimate values between them. The resulting equal-value lines provide a continuous visual representation of spatial variation across the mapped area.
How do you create a contour map from data points?
To create a contour map, each data point must have an X coordinate, Y coordinate, and a value to be plotted. For a topographic map, for example, the third value would typically be elevation. An interpolation method estimates values between the known observations, after which contour lines are generated at selected intervals. The reliability of the resulting map depends on the quality, density, and spatial distribution of the original data points.
What do contour lines represent?
A contour line connects locations assigned the same value within the mapped surface. On a topographic contour map, a 100 m contour represents locations interpreted to have an elevation of 100 m. For other datasets, contours may represent equal values of another spatially meaningful parameter. The meaning of the lines must therefore always be interpreted according to the variable being plotted.
How does interpolation work in a contour map?
Interpolation estimates values in the unknown spaces between measured or defined data points. The resulting surface depends on the locations and spacing of observations as well as the assumptions of the selected interpolation approach. Areas with dense, well-distributed data are generally better constrained than areas with sparse observations. Importantly, an interpolated value remains an estimate rather than a new field measurement.
What is the difference between a contour map and a 3D surface plot?
A contour map represents spatial variation in two dimensions using equal-value lines, while a 3D surface plot displays the same type of variation as a three-dimensional surface. Contours are compact and particularly useful for plans, numerical interpretation, and engineering reports. A 3D model can make complex geometry and spatial relationships easier to visualize. Neither representation, however, increases the accuracy or quantity of the underlying data.
How are contour maps used in geotechnical engineering?
Contour maps can help geotechnical engineers interpret spatial variation across a project site using information collected from boreholes, surveys, groundwater observations, and other investigation locations. They may be used to visualize ground elevations, interpreted subsurface surfaces, or other spatially meaningful data where interpolation is justified. These maps should be evaluated together with stratigraphy, groundwater conditions, geological interpretation, and field and laboratory results. Their greatest value comes when they contribute to a broader geotechnical ground model rather than functioning as isolated graphics.
Can a contour map predict soil conditions between boreholes?
No, not directly. A contour map can interpolate and visualize possible spatial trends between boreholes, but those interpolated values are not direct observations of the ground between investigation locations. Actual subsurface conditions may contain boundaries, local variations, or geological features that are not captured by the available boreholes. Contour interpretation should therefore remain connected to the site investigation and be supported by geological and geotechnical engineering judgment rather than treated as a substitute for additional ground investigation.