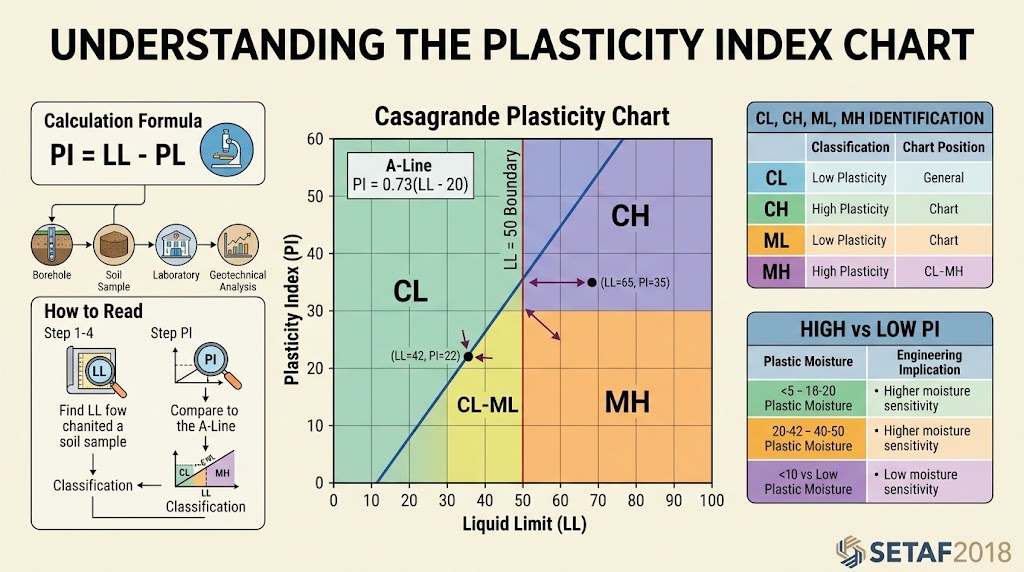
A plasticity index chart is used in geotechnical engineering to evaluate and classify fine-grained soils based on two laboratory-derived parameters: the Liquid Limit (LL) and the Plasticity Index (PI). The plasticity index is calculated from the Atterberg limits using the relationship:
PI = LL − PL
where PL is the Plastic Limit. The resulting PI represents the range of water contents over which a soil exhibits plastic behavior.
Looking at the plasticity index alone provides useful information, but plotting PI against the Liquid Limit gives engineers a clearer picture of how a fine-grained soil is likely to behave. The Casagrande plasticity chart uses this relationship to distinguish broad clay-like and silt-like behavior and to separate soils into different plasticity groups for classification purposes.
Understanding how to use the chart therefore begins with understanding what the plasticity index itself represents.
What Is the Plasticity Index of Soil?
The Plasticity Index (PI) represents the range of water contents over which a fine-grained soil behaves plastically. It is determined from two Atterberg limits and calculated using the following relationship:
Plasticity Index (PI) = Liquid Limit (LL) − Plastic Limit (PL)
For example, if a soil has a Liquid Limit of 45% and a Plastic Limit of 22%, its plasticity index is:
PI = 45 − 22 = 23%
This means the soil remains in a plastic state across a 23-percentage-point range of water content.
In general, a higher PI indicates a wider plastic moisture range, while a lower PI indicates a narrower range. A PI close to zero suggests that the soil exhibits little or no plastic behavior.
However, plasticity index values should not be interpreted in isolation. A high PI does not simply mean “clay,” just as a low PI does not automatically identify a soil as silt. PI is interpreted together with the Liquid Limit and the soil’s position on the plasticity chart. It describes the consistency behavior of fine-grained soil rather than directly measuring the percentage of clay particles it contains.
What Is a Plasticity Index Chart?
A plasticity index chart is a graphical tool used to interpret the consistency characteristics of fine-grained soils from their Atterberg limit results. In the commonly used Casagrande plasticity chart, the Liquid Limit (LL) is plotted on the horizontal axis, while the Plasticity Index (PI) is plotted on the vertical axis.
X-axis → Liquid Limit (LL)
Y-axis → Plasticity Index (PI)
By plotting a soil sample according to these two values, engineers can evaluate its position relative to established boundaries such as the A-Line and the LL = 50 division. These boundaries help distinguish broad clay-like and silt-like behavior and support the classification of fine-grained soils into groups such as CL, CH, ML, MH, and CL-ML.
The chart therefore provides a practical way to interpret Atterberg limit results and visualize the relationship between liquid limit and plasticity.
It is important to distinguish the Plasticity Index from the plasticity chart. The Plasticity Index is a numerical value calculated as PI = LL − PL. The plasticity chart is the graphical framework in which that PI value is plotted together with the Liquid Limit to support soil classification and interpretation. The resulting classification is one of the first results recorded in a geotechnical report.
Plasticity Index Chart
Recommended visual: A Liquid Limit (%) vs. Plasticity Index (%) chart showing the A-Line, LL = 50 boundary, and CL, CH, ML, MH, and CL-ML regions.
How to Read a Plasticity Index Chart
Reading a plasticity index chart begins with the laboratory values used to define the soil’s consistency. The process is straightforward, but each step matters because the final classification depends on the relationship between the Liquid Limit (LL) and the Plasticity Index (PI) rather than on either value alone.
Step 1 – Determine the Liquid Limit and Plastic Limit
Laboratory testing provides the Liquid Limit (LL) and Plastic Limit (PL). These values are used to calculate the Plasticity Index:
PI = LL − PL
For example, if LL = 48% and PL = 24%, then:
PI = 48 − 24 = 24%
Step 2 – Plot Liquid Limit on the X-Axis
The Liquid Limit is used as the horizontal coordinate on the chart. Locate the LL value along the x-axis.
Step 3 – Plot Plasticity Index on the Y-Axis
Next, locate the calculated Plasticity Index on the vertical axis. The intersection of the LL and PI values gives the soil sample’s position on the chart.
Step 4 – Compare the Point With the A-Line
Once the point is plotted, compare its position with the A-Line, one of the main boundaries on the Casagrande plasticity chart. Whether the point falls above, below, or close to this line plays a central role in distinguishing different types of fine-grained soil behavior.
The exact interpretation of the A-Line and the resulting soil groups depends on the chart boundaries, which are examined in the next section.
What Is the A-Line on the Plasticity Chart?
The A-Line on the plasticity chart is an empirical boundary used in the Unified Soil Classification System (USCS) to help distinguish broad clay-like and silt-like behavior in fine-grained soils. On the Casagrande plasticity chart, it is commonly represented by the relationship:
PI = 0.73 (LL − 20)
where PI is the Plasticity Index and LL is the Liquid Limit.
Once a soil’s LL and PI values are plotted, its position relative to the A-Line becomes an important part of classification. In general, points above the A-Line fall within clay groups, while points below the A-Line fall within silt groups, subject to the other boundaries and criteria of the classification system.
The chart also uses a Liquid Limit of 50% as a major vertical division. Soils with LL < 50 fall within the lower-liquid-limit groups, while soils with LL ≥ 50 fall within the higher-liquid-limit groups. Combined with the A-Line, this division helps define regions such as CL, CH, ML, and MH.
Importantly, the Casagrande A-Line is not a grain-size boundary and does not measure the percentage of clay in a soil. It is an empirical classification boundary based on consistency behavior derived from Atterberg limit results. This is why the plasticity chart provides information about how fine-grained soil behaves rather than directly describing its particle-size composition.
Plasticity Chart Soil Classification: CL, CH, ML and MH
In the Unified Soil Classification System (USCS), the plasticity chart helps classify fine-grained soils by combining their position relative to the A-Line with their Liquid Limit (LL). The resulting regions include the commonly encountered CL, CH, ML, and MH groups, along with the transitional CL-ML zone.
| Symbol | General Classification | Chart Position |
| CL | Inorganic clay, lower liquid limit | Above A-Line, LL < 50 |
| CH | Inorganic clay, higher liquid limit | Above A-Line, LL ≥ 50 |
| ML | Inorganic silt, lower liquid limit | Below A-Line, LL < 50 |
| MH | Inorganic silt, higher liquid limit | Below A-Line, LL ≥ 50 |
| CL-ML | Transitional silty clay zone | Near A-Line at low PI |
The A-Line primarily separates clay-like from silt-like consistency behavior, while LL = 50 provides the major vertical division between the L and H groups. For this reason, it is more precise to understand L and H in this context through the Liquid Limit boundary rather than treating them simply as labels for “low” and “high plasticity.”
For example, a point above the A-Line with an LL below 50 generally falls in the CL region, whereas a point above the A-Line with an LL of 50 or greater falls in the CH region.
The chart, however, should not be treated as a complete description of a soil. Final geotechnical interpretation should consider plasticity data alongside particle-size distribution, natural water content, stratigraphy, field observations, laboratory results, and other relevant engineering properties.
Worked Plasticity Index Chart Example
A numerical example shows how the Plasticity Index (PI), A-Line, and Liquid Limit (LL) work together on the plasticity chart. Consider a fine-grained soil with the following laboratory results:
Liquid Limit (LL) = 42%
Plastic Limit (PL) = 20%
First, calculate the Plasticity Index:
PI = LL − PL
PI = 42 − 20 = 22%
The soil is therefore plotted at LL = 42 on the horizontal axis and PI = 22 on the vertical axis.
Next, calculate the A-Line value corresponding to a Liquid Limit of 42:
PIₐ = 0.73 × (LL − 20)
PIₐ = 0.73 × (42 − 20) ≈ 16.1
The soil’s actual PI of 22 is greater than the A-Line value of 16.1, meaning that the plotted point lies above the A-Line. Since its Liquid Limit is also below 50, the point falls within the CL region of the USCS plasticity chart, corresponding to inorganic clay in the lower-liquid-limit group.
For comparison, consider a soil with LL = 65 and PI = 35. The A-Line value at LL = 65 is approximately 32.9, so the point lies above the A-Line. Because LL is also greater than 50, it falls within the CH region under the applicable USCS chart criteria.
What Does a High or Low Plasticity Index Mean?
The magnitude of the Plasticity Index (PI) provides useful information about how a fine-grained soil may respond to changes in water content. However, PI should be treated as an index property that supports engineering interpretation, not as a standalone predictor of soil performance.
Higher Plasticity Index
A higher PI means that the soil remains in a plastic state over a wider range of water contents. Such soils are generally associated with greater sensitivity to moisture changes and can experience more significant changes in consistency as water content varies.
In many clayey soils, higher plasticity may also be associated with greater compressibility potential and more pronounced shrink–swell behavior. These relationships depend strongly on factors such as clay mineralogy, soil structure, stress history, density, and environmental conditions. Two soils with similar PI values therefore do not necessarily exhibit the same engineering behavior.
Lower Plasticity Index
A lower PI indicates a narrower range of water contents over which the soil behaves plastically. It may be associated with lower-plasticity fine-grained materials, more silt-like behavior, or soils containing relatively limited plastic fines.
Neither a high nor low PI can independently predict settlement, shear strength, swelling potential, or bearing capacity. These behaviors require additional information about the soil profile, groundwater conditions, mechanical properties, stress state, and loading conditions. PI is therefore most useful when interpreted as one component of a broader geotechnical ground model.
Plasticity Index vs Liquid Limit vs Plastic Limit
The Liquid Limit (LL), Plastic Limit (PL), and Plasticity Index (PI) are closely related Atterberg limit parameters, but each describes a different aspect of fine-grained soil consistency. Understanding their relationship is more useful than interpreting any one value independently.
| Parameter | Meaning |
| Liquid Limit (LL) | Water content at the transition toward liquid behavior |
| Plastic Limit (PL) | Water content at the transition between plastic and semi-solid behavior |
| Plasticity Index (PI) | Width of the plastic moisture range: LL − PL |
The Liquid Limit and Plastic Limit define the boundaries of the soil’s plastic state, while the Plasticity Index measures the range between those boundaries. For example, two soils may have the same PI but different LL and PL values, meaning their overall consistency characteristics are not necessarily identical. This is one reason PI should be interpreted together with the underlying consistency limits and other soil properties.
Another useful parameter is the natural water content (wₙ), which represents the soil’s water content under its existing field condition. Comparing wₙ with the Liquid and Plastic Limits can provide additional information about the soil’s current consistency or state. This moves the interpretation beyond classification alone and helps connect laboratory index properties with the actual ground conditions encountered in a geotechnical investigation.
Plasticity Index vs Liquidity Index
The Plasticity Index (PI) and Liquidity Index (IL) both use Atterberg limit data, but they describe different aspects of fine-grained soil behavior.
The Plasticity Index defines the width of the moisture-content range over which a soil behaves plastically. It is calculated as:
PI = LL − PL
The Liquidity Index, in contrast, relates the soil’s natural water content (wₙ) to its Plastic Limit and Liquid Limit. It can be calculated as:
IL = (wₙ − PL) / PI
The distinction between the two can be expressed simply: PI answers “How wide is the soil’s plastic range?”, while IL answers “Where is the soil’s current natural water content relative to that range?”
For example, soils with similar Plasticity Index values may have very different Liquidity Index values if their natural water contents differ. They may therefore occupy similar plasticity ranges while existing in different consistency states under field conditions.
For geotechnical interpretation, PI and IL are consequently complementary rather than interchangeable. Considering wₙ, LL, PL, PI, and IL together provides a more complete picture of consistency conditions than relying on the Plasticity Index alone.
Why Plasticity Index Matters in Geotechnical Engineering
The Plasticity Index (PI) is more than a soil classification value. It provides an initial indication of how fine-grained soils may respond to changes in water content and helps engineers interpret laboratory results within the broader context of ground behavior.
PI contributes to the classification of fine-grained soils and the assessment of their consistency characteristics. It can also provide preliminary insight into moisture sensitivity and, when considered alongside other properties, potential compressibility or expansive behavior. Plasticity data may further support the selection and interpretation of geotechnical parameters used in subsequent analyses. In some methodologies, PI is also included among the criteria used to screen fine-grained soils for liquefaction susceptibility.
However, plasticity index is an index property, not a complete constitutive model of soil behavior. A PI value alone should not be used to determine bearing capacity, predict settlement, define shear strength, evaluate slope stability, or design a foundation.
These engineering problems require PI to be interpreted together with the soil profile, groundwater conditions, field investigation data, laboratory test results, strength parameters, and deformation parameters. Loading conditions and the specific engineering problem must also be considered.
The practical workflow therefore extends beyond simply calculating and plotting PI:
Ground Data → Engineering Model → Analysis
Within this process, the Plasticity Index helps characterize the ground, while the complete geotechnical model provides the basis for engineering calculations and design decisions.
From Plasticity Test Results to a Usable Ground Model
A plasticity chart provides a useful way to interpret laboratory results, but geotechnical design requires those results to remain connected to the ground conditions they represent. A Plasticity Index value becomes more meaningful when engineers know where the sample was obtained, which soil layer it represents, and how that layer relates to the overall subsurface profile.
A practical workflow can therefore be represented as:
Borehole → Soil Layer → Laboratory Sample → LL / PL → PI → Material Properties → Engineering Analysis
When plasticity data is evaluated only in an isolated spreadsheet or chart, this relationship can be difficult to maintain across multiple boreholes, samples, and soil layers. The PI may describe the plasticity of an individual specimen, but it does not by itself define the engineering behavior of the corresponding layer.
For a usable ground model, plasticity results should be considered alongside the sample depth, material definition, natural water content, groundwater conditions, and other index properties. Strength and deformation parameters must then be incorporated according to the engineering problem being evaluated.
This integration turns laboratory classification data into part of a broader geotechnical interpretation. Instead of treating PI as an isolated result, engineers can relate it to the soil profile and the parameters used for subsequent analyses. The objective is therefore not simply to produce a plasticity chart, but to connect laboratory observations with a consistent ground model that supports engineering calculations and design decisions.
Working With Plasticity Index Data in SETAF2018
Plasticity data becomes more useful when it remains connected to the soil materials and borehole information from which it was obtained. SETAF2018 provides an environment where consistency parameters can be defined, calculated, and visualized as part of the broader geotechnical project model.
Define Consistency Parameters Within the Soil Model
Within SETAF2018 material definitions, engineers can define physical properties including natural water content (wₙ), Liquid Limit (wL), Plastic Limit (wP), shrinkage limit, Plasticity Index (IP), and Liquidity Index (IL). When the required input data is available, the software can automatically calculate parameters including the Plasticity Index and Liquidity Index.
This allows laboratory-derived consistency properties to remain associated with the materials used in the project model rather than being treated only as separate test results.
Visualize Plasticity Along the Ground Profile
SETAF2018 can plot natural water content, Liquid Limit, and Plastic Limit together, allowing their variation within the project data to be reviewed graphically. A separate Plasticity Index graph can also be generated.
This should be distinguished from the Casagrande plasticity chart discussed earlier. SETAF’s output provides a plasticity-index graph associated with project soil data, rather than simply replacing the laboratory classification chart.
Connect Index Properties With Engineering Analysis
The broader advantage is integration. Plasticity and consistency properties can remain within the same project environment as boreholes, soil materials, groundwater information, and engineering parameters used for subsequent geotechnical analyses.
As a result, PI does not have to remain an isolated laboratory number. With SETAF2018, it can form part of the ground-data workflow that supports foundation, excavation support, slope stability, and other geotechnical engineering evaluations.
Common Mistakes When Interpreting a Plasticity Index Chart
A plasticity index chart is relatively simple to use, but its results can easily be overinterpreted. Several common mistakes should be avoided when incorporating plasticity data into geotechnical assessment.
1. Treating PI alone as the soil classification.
Plasticity Index is only one parameter. Classification depends on PI together with the Liquid Limit, chart position, and the criteria of the classification system being used.
2. Confusing Plasticity Index with Liquid Limit.
LL defines a consistency boundary, whereas PI represents the range between the Liquid Limit and Plastic Limit: PI = LL − PL.
3. Assuming a high PI directly means a high clay percentage.
Plasticity reflects consistency behavior and is influenced by factors such as clay mineralogy. It is not a direct measurement of clay content.
4. Treating the A-Line as a grain-size boundary.
The A-Line is an empirical boundary based on Atterberg limit behavior. It does not physically separate clay-sized and silt-sized particles.
5. Using plasticity data alone to predict engineering performance.
PI cannot independently determine settlement, bearing capacity, shear strength, or shrink–swell behavior.
Plasticity and other index properties should therefore support the ground model rather than replace it, alongside stratigraphy, groundwater conditions, field and laboratory testing, and engineering parameters.
Conclusion: A Plasticity Chart Is a Starting Point, Not the Ground Model
The plasticity index chart provides a practical framework for turning Atterberg limit results into useful information about fine-grained soil behavior and classification:
LL + PL → PI → Chart Position → Classification Insight
For engineering design, however, the process must continue beyond classification:
Laboratory Result → Soil Layer → Ground Model → Engineering Parameters → Analysis
A plotted point can indicate how a soil behaves within a classification framework, but it cannot independently describe the strength, deformation, groundwater response, or overall performance of the ground. These require a geotechnical model that combines laboratory results with boreholes, stratigraphy, groundwater conditions, and appropriate mechanical parameters. Compressibility parameters in particular are measured in an oedometer test rather than inferred from index properties.
This is where an integrated workflow becomes valuable. SETAF2018 can help engineers organize consistency-limit and plasticity data alongside boreholes, material properties, and the wider geotechnical model, keeping laboratory results connected to the engineering conditions and analyses for which they are ultimately being used.
FAQ
What is a plasticity index chart?
A plasticity index chart is a graphical tool used to interpret and classify fine-grained soils based on their Liquid Limit (LL) and Plasticity Index (PI). In the commonly used Casagrande plasticity chart, LL is plotted on the horizontal axis and PI on the vertical axis. Boundaries such as the A-Line help distinguish broad clay-like and silt-like consistency behavior. Within the USCS framework, the chart contributes to classifications such as CL, CH, ML, and MH.
How do you calculate the plasticity index of soil?
The Plasticity Index (PI) is calculated by subtracting the Plastic Limit from the Liquid Limit:
PI = LL − PL
For example, if a soil has a Liquid Limit of 48% and a Plastic Limit of 21%, its Plasticity Index is 27%. This value represents the range of water contents over which the soil exhibits plastic behavior.
What is the A-Line on a plasticity chart?
The A-Line is an empirical boundary on the Casagrande plasticity chart commonly expressed as PI = 0.73(LL − 20). Within the USCS framework, fine-grained soils plotting above the A-Line generally fall within clay groups, while those plotting below it generally fall within silt groups. The A-Line describes consistency behavior rather than particle-size distribution. It should therefore not be interpreted as a direct boundary between clay-sized and silt-sized particles.
What does a high plasticity index mean?
A high Plasticity Index means that a soil remains plastic over a relatively wide range of water contents. Higher PI values may be associated with greater moisture sensitivity, compressibility potential, and shrink–swell behavior in some clayey soils. However, these relationships also depend on mineralogy, soil structure, stress history, and other properties. PI alone cannot determine how a soil will perform under engineering loads.
What is the difference between liquid limit and plasticity index?
The Liquid Limit (LL) is the water content associated with the boundary between the plastic and liquid states of a fine-grained soil. The Plasticity Index (PI) instead represents the width of the plastic range and is calculated as LL − PL. Therefore, LL is a consistency limit, while PI is derived from the difference between two consistency limits. Both values are used together when plotting and interpreting a soil on the plasticity chart.
How are CL, CH, ML and MH identified on a plasticity chart?
USCS plasticity chart classification primarily considers a soil’s position relative to the A-Line and the LL = 50 boundary. Points above the A-Line generally correspond to clay groups, while points below it generally correspond to silt groups. With LL below 50, these regions generally correspond to CL or ML; with LL at or above 50, they correspond to CH or MH. The complete USCS classification should still consider the applicable classification criteria and other laboratory data.
Can plasticity index be used to predict soil settlement?
Plasticity Index cannot independently predict soil settlement. PI can provide useful indications about fine-grained soil behavior and may correlate with compressibility characteristics in some soils, but settlement depends on a much broader set of conditions. These include soil stratigraphy, foundation loading, stress increase with depth, groundwater conditions, layer thickness, and appropriate compressibility or deformation parameters. Settlement assessment therefore requires an appropriate engineering calculation method based on a representative ground model rather than a Plasticity Index value alone.