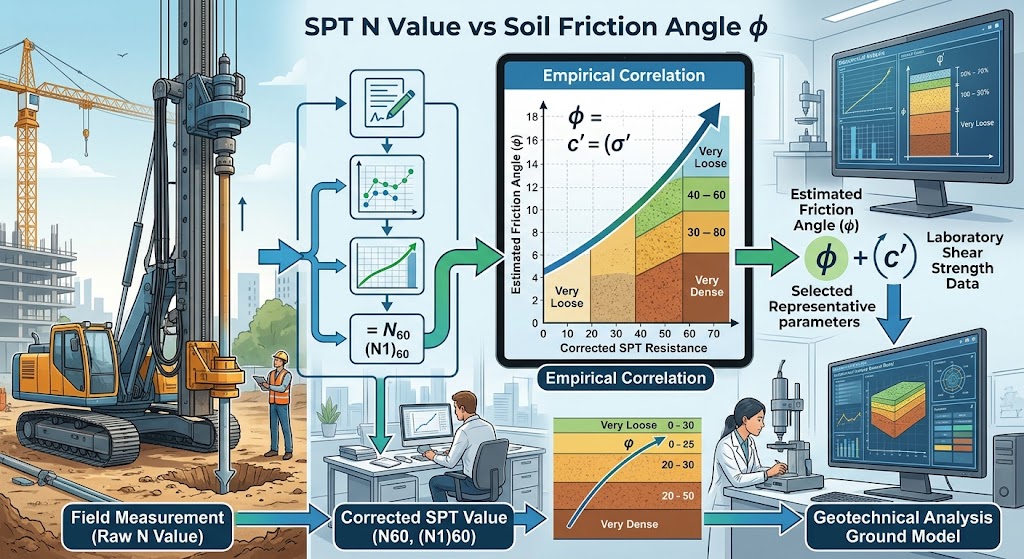
The SPT N value and soil friction angle (φ) are empirically related, particularly in granular soils such as sands, where both parameters can reflect aspects of soil density and resistance. In general, higher penetration resistance may be associated with a higher friction angle, but this relationship must be interpreted carefully.
SPT does not directly measure the friction angle. Instead, engineers use empirical correlations to estimate φ from appropriately interpreted and corrected SPT results:
Field Measurement → Corrected SPT Value → Empirical Correlation → Estimated Friction Angle
These correlations can support preliminary parameter estimation, especially when laboratory shear-strength data is limited. They may also help engineers interpret site investigation results, compare parameters obtained from different sources, and check whether selected design values are reasonable.
However, the basis of the correlation matters. A raw field N value, energy-corrected N60, and overburden-normalized (N1)60 are not interchangeable, and a correlation developed for one should not automatically be applied to another.
Understanding the relationship therefore requires first understanding what the SPT N value actually represents.
What Is the SPT N Value?
The SPT N value is the primary field result obtained from the Standard Penetration Test (SPT), one of the most widely used in-situ tests in geotechnical site investigations. During the test, a standard sampler is driven into the soil through specified penetration increments using repeated blows from a hammer system.
The N value represents the number of hammer blows required to achieve the specified penetration interval used for SPT resistance. It therefore provides a practical measure of the soil’s resistance to penetration at the tested depth.
Particularly in granular soils, SPT N values can help engineers interpret penetration resistance, relative density, and variations in ground conditions with depth. They are also widely used as inputs to empirical correlations for estimating engineering parameters such as friction angle.
However, N is a field test result, not a fundamental soil property. The measured blow count is influenced not only by the soil itself but also by factors such as effective stress, equipment configuration, hammer energy actually delivered, and test procedures. Two identical soils tested under different conditions may therefore produce different measured N values.
For this reason, the raw field N value often requires appropriate corrections or normalization before being used in engineering correlations. This leads to an important distinction between the measured N value, N60, and (N1)60.
How Are SPT N Value and Friction Angle Related?
The relationship between SPT N value and friction angle (φ) is primarily empirical. In granular soils, increasing density generally results in greater resistance to penetration during the Standard Penetration Test. Denser granular soils may also mobilize greater frictional resistance, which creates the basis for correlations between SPT resistance and friction angle.
Conceptually, the general trend can be expressed as:
Higher corrected SPT resistance → generally higher estimated friction angle
Based on observed field and experimental behavior, various empirical relationships have therefore been developed to estimate φ using corrected SPT values. These correlations can be useful when interpreting site investigation data or developing preliminary engineering parameters.
However, this is not a universal one-to-one relationship. Friction angle is influenced by several characteristics beyond penetration resistance, including particle shape, grading, mineralogy, density, confining or effective stress, stress history, and drainage conditions. Different soils with the same corrected SPT resistance can therefore have different friction angles.
Most importantly, the SPT N value can be correlated with friction angle, but it does not directly measure friction angle. The resulting φ should be understood as an empirical estimate whose reliability depends on the soil conditions, the corrections applied to the SPT result, and the applicability of the selected correlation.
This is why identifying whether a correlation uses raw N, N60, or (N1)60 is essential before applying it to engineering interpretation.
SPT N Value vs Friction Angle Chart
An SPT N value vs friction angle chart provides a convenient way to understand the general relationship between penetration resistance, granular soil condition, and estimated friction angle. For granular soils, increasing SPT resistance is commonly associated with increasing density and, in turn, a tendency toward higher friction angles.
The relationship can be summarized conceptually as follows:
| SPT Resistance | General Granular Soil Condition | Expected Friction-Angle Trend |
| Very low N | Very loose | Lower φ range |
| Low N | Loose | Relatively lower φ |
| Moderate N | Medium dense | Intermediate φ |
| High N | Dense | Higher φ |
| Very high N | Very dense | Higher φ, correlation-dependent |
This table intentionally shows trends rather than fixed friction-angle values. Published SPT–φ correlations are not identical, and different methods may be based on raw N, energy-corrected N60, or overburden-normalized (N1)60 values. Soil type, effective stress conditions, particle characteristics, and the dataset from which the correlation was developed can also affect the estimated friction angle.
For this reason, a generic chart can support preliminary interpretation, but it should not be used as a universal conversion table in which:
N = X → φ must equal Y
An engineer should first identify which SPT value the selected correlation requires and whether the correlation is appropriate for the soil and stress conditions being evaluated. The chart is therefore best understood as showing the expected direction of the relationship, while numerical φ estimation requires a clearly defined and applicable correlation.
Raw N, N60 and (N1)60 Are Not the Same
When using an SPT N value to estimate friction angle, it is essential to identify which form of the penetration resistance is required by the selected correlation. Raw N, N60, and (N1)60 represent different stages of correction or normalization and should not be treated as interchangeable.
Measured SPT N Value
The measured N value is the field blow count obtained during the Standard Penetration Test. Although it reflects soil resistance, the recorded value is also influenced by the test system and field conditions. Differences in equipment, hammer efficiency, borehole configuration, and testing procedure can therefore affect the measured N even under similar ground conditions.
N60 – Energy-Corrected SPT Value
N60 adjusts the measured N value to a reference hammer energy ratio of 60%. Depending on the procedure being followed, the correction considers factors associated with hammer energy, borehole diameter, rod length, and sampler configuration.
This normalization improves comparability between SPT results obtained using different equipment and field setups and provides the basis required by many empirical correlations.
(N1)60 – Overburden-Normalized Value
Penetration resistance is also affected by effective overburden stress. The (N1)60 value further normalizes N60 to a reference effective overburden stress, allowing SPT resistance measured at different depths or stress conditions to be compared on a more consistent basis.
This distinction is critical when estimating φ: a correlation developed for N60 or (N1)60 should not automatically be applied to an uncorrected field N value. Before using any SPT–friction angle relationship, engineers should verify both the required correction basis and the conditions under which the correlation was developed.
How Is Friction Angle Estimated From SPT N Value?
Estimating the friction angle (φ) from an SPT N value is not a single-formula calculation. The appropriate approach depends on how the SPT result has been corrected, the soil being evaluated, and the empirical relationship selected for the analysis. A typical workflow is:
Measured N → Apply Relevant Corrections → Obtain N60/(N1)60 → Select Applicable Correlation → Estimate φ → Engineering Review
Empirical Equations
Various researchers have developed empirical equations relating SPT resistance to friction angle, particularly for granular soils. Depending on the method, these relationships may use the measured N value, N60, (N1)60, effective vertical stress, relative density, or a combination of these variables.
The input definition is therefore as important as the equation itself. An equation calibrated using (N1)60, for example, should not be used directly with an uncorrected field N value.
Correlation Charts
Some methods present the relationship graphically rather than through a direct equation. Engineers enter the applicable chart using the required corrected SPT resistance and obtain a corresponding estimated friction angle or range. These charts remain empirical and are subject to the same applicability limitations as equations.
Correlation Selection Matters
Before estimating φ, engineers should verify that the selected correlation is appropriate for the soil type, SPT correction basis, effective stress conditions, and intended engineering application.
The objective is therefore not to find a formula that converts any N value into φ. It is to select an applicable correlation, use the correct input parameters, and then review the resulting estimate against the broader geotechnical investigation before adopting an engineering parameter.
Worked Example: From SPT N Value to Estimated Friction Angle
Consider a granular soil layer where the measured SPT N value is 18. It may be tempting to enter this value directly into an SPT–friction angle equation, but doing so would only be appropriate if the selected correlation was specifically developed for uncorrected N values under comparable test conditions.
A more defensible workflow is:
- Review the SPT test conditions. Confirm the hammer system, delivered energy, borehole diameter, rod length, sampler configuration, and other relevant test information.
- Apply the required energy and equipment corrections according to the procedure being followed.
- Use these corrections to convert the measured N = 18 into the corresponding N60 value.
- If required by the selected correlation, account for effective overburden stress to obtain (N1)60.
- Identify a published friction-angle correlation that is applicable to the soil type and uses the same corrected SPT parameter.
- Enter the calculated N60 or (N1)60 value into that correlation.
- Obtain the corresponding estimated friction angle (φ) and evaluate whether it is consistent with the soil description, density, stress conditions, and other available investigation data.
No numerical φ is assigned here because doing so without specifying the correction factors and correlation would imply unjustified precision.
The resulting φ is a correlation-based estimate, not the result of a direct shear or triaxial test. It should therefore be reviewed as part of the broader engineering parameter-selection process.
How Soil Density Affects SPT N Value and Friction Angle
In granular soils, soil density provides an important physical link between SPT N value and friction angle. A looser particle arrangement generally offers less resistance to sampler penetration, while a denser arrangement provides greater resistance and can mobilize higher shear resistance.
The general relationship can be expressed conceptually as:
Loose structure → lower penetration resistance → generally lower N → generally lower frictional resistance
Dense structure → greater penetration resistance → higher N → often higher peak friction angle
However, density alone does not create a universal φ(N) relationship. The behavior of granular soils is also influenced by relative density, particle angularity, grading, confining pressure, stress history, and mineral characteristics. Consequently, two sands with similar SPT resistance may not mobilize exactly the same friction angle.
Dilation is particularly important when interpreting dense granular soils. During shearing, densely packed particles may need to move over and around adjacent particles, causing the soil to increase in volume. This dilative behavior can contribute to the mobilization of a peak friction angle greater than the frictional resistance associated with a non-dilative or critical-state condition.
For this reason, the observed relationship between density, SPT resistance, and φ should be treated as a behavioral trend rather than a fixed conversion. SPT-based correlations remain empirical estimates and should be interpreted within the soil’s actual stress and material conditions.
Does the SPT N–Friction Angle Correlation Work for All Soils?
No. Correlations between SPT N value and friction angle (φ) are particularly associated with granular soils, especially sands. Their applicability becomes more uncertain as soil behavior is increasingly influenced by fines, plasticity, drainage conditions, and cohesive characteristics.
Sands and Granular Soils
For sands and other suitable granular soils, SPT resistance is commonly used as an indicator of in-situ density and penetration resistance. When the appropriate corrections are applied, SPT-based correlations can provide useful preliminary estimates of friction angle. The selected correlation should still be compatible with the soil type, stress conditions, and corrected N-value definition.
Silts and Mixed Soils
The relationship becomes less straightforward in silts and soils containing significant fines. Fines content, plasticity, saturation, drainage behavior, and soil fabric can influence both SPT resistance and shear behavior. A correlation developed primarily from clean sand data may therefore provide an unreliable estimate when applied directly to mixed or silty soils.
Clays
Greater caution is required for cohesive soils. A friction-angle chart or equation developed for granular soils should not be used casually to estimate the drained φ of clay from its SPT N value. Depending on the engineering problem, laboratory shear testing, strength parameters, stress history, and other field or laboratory data may provide a more appropriate basis for parameter selection.
A correlation developed for sand should not be transferred to clay simply because both materials have an SPT N value. Correlation selection must reflect the actual soil behavior and engineering conditions being evaluated.
SPT-Correlated Friction Angle vs Laboratory-Measured Friction Angle
An SPT-correlated friction angle and a friction angle derived from laboratory shear testing provide different forms of evidence about soil behavior. Understanding this distinction is important when selecting representative parameters for geotechnical analysis.
Correlated φ
A correlated φ is obtained indirectly through an empirical relationship between SPT resistance and friction angle. This approach is relatively quick, uses data commonly available from site investigations, and can be valuable during preliminary interpretation or when checking parameters obtained from other sources.
However, the result carries uncertainty associated with the selected correlation, SPT corrections, stress conditions, and the soil types represented by the original correlation dataset. It should therefore be treated as an estimate rather than a direct determination of shear behavior.
Laboratory-Derived φ
Friction angle can also be derived from laboratory tests such as direct shear and triaxial tests. These methods evaluate soil shear behavior under defined stress and drainage conditions, providing a more direct basis for interpreting shear-strength parameters.
Laboratory results are not automatically definitive, however. Sample quality, disturbance, specimen preparation, drainage conditions, applied stress range, stress path, and interpretation of the test results can all influence the derived friction angle.
For engineering parameter selection, the objective should not be to automatically prefer one source over another. Measured/test-derived and correlated parameters should be reconciled, not blindly substituted for one another, with differences evaluated against the ground conditions and the engineering problem being analyzed.
Which Friction Angle Should Be Used in Geotechnical Design?
Selecting a friction angle for geotechnical design is not a matter of finding the highest φ value available from field correlations or laboratory testing. The objective is to select a representative parameter appropriate for the soil conditions, engineering problem, and analysis method.
Parameter selection should consider the quality of the site investigation, field test results, laboratory data, and variability within the soil profile. Effective stress conditions and drainage behavior must also be consistent with the analysis being performed. Where relevant, engineers may need to distinguish between peak, critical-state, or residual friction angles, since these values represent different stages or mechanisms of soil shear behavior.
The design methodology also matters. A friction angle appropriate for one limit state or geotechnical problem should not automatically be transferred to another without considering how the parameter is mobilized and used in the calculation.
An SPT-based correlation can contribute valuable evidence to this process, particularly for granular soils, but it should be evaluated alongside all available investigation data rather than adopted automatically. For a broader discussion of how the friction angle of soil relates to shear behavior, parameter selection, and practical geotechnical design, these concepts should be considered within the complete ground model.
Ultimately, parameter estimation provides possible values; engineering interpretation determines which value is appropriate for design.
Where Does Friction Angle Affect Geotechnical Analysis?
The friction angle (φ) becomes an engineering parameter when the interpreted soil behavior is incorporated into geotechnical calculations. It is particularly important in problems involving effective-stress shear resistance, where frictional resistance contributes to the soil’s ability to resist applied loads and deformation mechanisms.
Within the Mohr-Coulomb shear-strength framework, effective-stress shear resistance can be expressed as:
τ = c′ + σ′ tan φ′
where c′ is effective cohesion, σ′ is the effective normal stress, and φ′ is the effective friction angle. This relationship shows why φ cannot be considered independently from the stress state and other shear-strength parameters.
Depending on the analysis method, friction angle can influence calculations involving bearing capacity, lateral earth pressures, retaining walls, excavation support systems, slope stability, pile resistance, and foundation behavior. A change in the selected φ may therefore affect calculated resistance, earth-pressure coefficients, or stability results.
However, friction angle is only one component of the engineering model. Groundwater conditions affect effective stresses, while stratigraphy, cohesion, unit weight, geometry, loading, and other soil parameters influence the overall response.
The engineering workflow must therefore extend beyond estimating φ from an SPT correlation:
SPT Data → Parameter Interpretation → Ground Model → Engineering Analysis
This is where keeping investigation data, selected soil parameters, and the engineering system within a connected geotechnical model becomes particularly valuable.
From SPT Data to an Engineering Ground Model
An SPT-based correlation can answer a relatively narrow question:
What friction angle might correspond to this SPT resistance?
Geotechnical design requires a broader question to be answered:
Which parameter represents this soil layer under the engineering conditions being analyzed?
Moving from one to the other requires an interpretation workflow rather than a simple N-to-φ conversion:
Borehole → SPT Profile → Corrections → Correlation → Parameter Interpretation → Soil Layer → Ground Model → Analysis
When correlations are performed only in standalone spreadsheets, the estimated friction angle can become disconnected from the context that gives it engineering meaning. An SPT result belongs to a specific borehole depth and stratigraphic layer, with particular groundwater and effective-stress conditions. It should also be evaluated alongside the material definition and other available field and laboratory test results.
This distinction is fundamental: parameter estimation is not the same as parameter selection. A correlation may provide a plausible φ value or range, but selecting the parameter used in analysis requires engineers to consider whether that estimate is representative of the relevant soil layer and appropriate for the design condition.
The purpose of the workflow is therefore not simply to convert SPT N values into friction angles. It is to transform investigation results into a consistent engineering ground model, where selected parameters remain connected to the stratigraphy, groundwater conditions, and soil behavior they represent before being used in subsequent geotechnical analyses.
Working With SPT and Friction Angle Data in SETAF2018
SPT-based friction angle correlations are most useful when the resulting parameter remains connected to the investigation data from which it was derived. In a geotechnical workflow, this means maintaining the relationship between boreholes, SPT results, stratigraphy, material definitions, and the engineering parameters ultimately used in analysis.
Keep SPT Data Connected to Boreholes and Soil Layers
In SETAF2018, multiple boreholes can be defined together with their stratigraphy and field test information, including SPT data. This allows SPT results to remain associated with their borehole location, depth or elevation, and corresponding soil layer, rather than existing only as isolated values in a separate spreadsheet.
Maintaining this context is important because the engineering meaning of an N value depends partly on where it occurs within the ground profile and the conditions represented by that layer.
Define Engineering Parameters Within the Ground Model
Once friction angle has been evaluated using appropriate correlations, laboratory results, and engineering judgment, the selected φ can be defined within the relevant soil or material properties of the ground model.
The responsibilities should remain distinct:
Correlation → assists parameter estimation
Engineer → selects the appropriate design/model parameter
Analysis software → uses the defined parameter
SETAF2018 therefore supports the engineering workflow rather than replacing parameter-selection judgment.
Use the Ground Model in Engineering Analysis
Once the ground conditions and material parameters are established, the model can support SETAF2018 workflows involving shallow foundations, piles and micropiles, retaining structures, excavation support systems, and slope stability, depending on the engineering problem.
The value of an SPT correlation is therefore not simply producing a friction angle, but helping transform investigation data into an engineering parameter that remains connected to the ground model and subsequent analysis.
Common Mistakes When Estimating Friction Angle From SPT
Estimating friction angle from SPT N values can be useful in geotechnical interpretation, but incorrect use of correlations can introduce significant uncertainty into the selected soil parameters. Several common mistakes should be avoided.
1. Using Raw N When the Correlation Requires N60
A measured field N value should not be inserted directly into a correlation developed for energy-corrected N60. The required SPT correction basis must always be checked first.
2. Confusing N60 With (N1)60
N60 accounts for test and energy-related corrections, while (N1)60 additionally normalizes penetration resistance for effective overburden stress. They are not interchangeable.
3. Applying One Correlation to Every Soil Type
A correlation developed for clean sands may not be appropriate for silts, mixed soils, or clays. Soil type and behavioral characteristics must match the correlation’s intended application.
4. Treating Correlated φ as a Direct Measurement
An SPT-derived friction angle is an empirical estimate, not a friction angle directly obtained from a shear test.
5. Ignoring Effective Stress and Overburden Conditions
Penetration resistance varies with effective stress. Ignoring stress conditions can distort both corrected SPT values and the resulting φ estimate.
6. Selecting a Design φ From a Single SPT Result
A single result may not represent an entire soil layer. Engineers should consider the SPT profile, stratigraphy, variability, groundwater, and other field and laboratory evidence before selecting a representative parameter.
Ultimately, a correlation should support engineering interpretation, not replace it.
Conclusion: SPT Correlations Estimate Friction Angle, They Do Not Measure It
The relationship between SPT N value and friction angle is best understood as an empirical parameter-estimation process rather than a direct measurement:
SPT N → Corrections → Correlation → Estimated φ
For geotechnical design, however, the workflow must extend further:
Investigation → SPT Profile → Parameter Interpretation → Ground Model → Engineering Analysis
SPT–friction angle correlations can be highly useful, particularly for granular soils and preliminary parameter assessment. Their reliability depends on using the appropriate SPT correction basis, selecting a correlation applicable to the soil and stress conditions, and understanding the uncertainty associated with empirical estimation.
The key distinctions remain: Correlation ≠ Measurement, and Estimated Parameter ≠ Automatically Selected Design Parameter. The resulting φ should be evaluated alongside stratigraphy, groundwater conditions, laboratory results, and other available investigation data before being adopted for analysis.
SETAF2018 helps extend this workflow by keeping borehole, SPT, soil-property, and engineering information within the wider geotechnical project model, allowing investigation data to remain connected to the analyses and design decisions it supports.
FAQ
What is the relationship between SPT N value and friction angle?
The relationship between SPT N value and friction angle (φ) is empirical, particularly for granular soils such as sands. Higher corrected SPT resistance is generally associated with denser soil conditions and may correspond to a higher estimated friction angle. However, SPT does not directly measure φ, and the relationship is influenced by soil type, density, effective stress, particle characteristics, and the correlation being used. SPT-based φ values should therefore be treated as engineering estimates rather than direct measurements.
How do you calculate friction angle from SPT N value?
Friction angle is typically estimated by first reviewing the measured SPT N value and applying the corrections required by the selected method. This may involve converting raw N to N60 and, where required, normalizing it for overburden stress to obtain (N1)60. An applicable empirical equation or correlation chart can then be used to estimate φ. The correlation must match the soil type, corrected SPT parameter, and stress conditions for which it was developed.
Does a higher SPT N value mean a higher friction angle?
In granular soils, a higher corrected SPT N value generally tends to correspond to a higher estimated friction angle because denser soils commonly exhibit both greater penetration resistance and greater frictional resistance. However, this is not a universal one-to-one relationship. Particle shape, grading, relative density, confining stress, mineralogy, and dilative behavior can all influence φ. Two soils with the same SPT resistance can therefore have different friction angles.
What is the difference between N, N60 and (N1)60?
The N value is the measured field blow count obtained from the Standard Penetration Test. N60 is the SPT resistance corrected to a reference hammer energy ratio of 60%, with relevant equipment-related corrections considered according to the applicable procedure. (N1)60 further normalizes N60 for effective overburden stress. Because they represent different stages of correction and normalization, N, N60, and (N1)60 should not be used interchangeably in SPT correlations.
Can SPT N value be used to estimate the friction angle of sand?
Yes. SPT-based empirical correlations are commonly used to estimate the friction angle of sands and other suitable granular soils, particularly during preliminary geotechnical interpretation. The SPT value must first be treated according to the requirements of the selected correlation, which may use N, N60, or (N1)60. The resulting φ remains a correlation-based estimate and should be checked against soil description, density, stress conditions, and other available field or laboratory evidence.
Can SPT N value be used to estimate friction angle in clay?
A sand-based SPT–φ correlation should not be directly applied to clay simply because an SPT N value is available. Cohesive soil behavior can depend strongly on plasticity, stress history, drainage conditions, structure, and other factors that are not represented by a granular-soil correlation. Depending on the engineering problem, laboratory shear testing and other field or laboratory data may provide a more appropriate basis for determining strength parameters. The correlation must therefore be compatible with the soil behavior being modeled.
Is friction angle estimated from SPT suitable for geotechnical design?
An SPT-correlated friction angle can contribute to the selection of design parameters, but it should not automatically become the φ used in analysis. Engineers should evaluate the estimate alongside stratigraphy, groundwater conditions, SPT profiles, other field tests, laboratory shear-strength data, effective stress conditions, and soil variability. The selected parameter must also be appropriate for the specific engineering problem and analysis methodology. In other words, SPT correlation supports parameter estimation, while engineering interpretation is required for parameter selection.