The Proctor compaction test is a laboratory test that compacts a soil at several water contents with a fixed energy and finds the water content at which that energy produces the highest dry density. Its two results, the maximum dry density and the optimum moisture content, are the reference values against which compacted fill is specified and accepted.

The procedure was introduced by Proctor (1933) for earth dam construction and is now standardised at two energy levels, ASTM D698 and ASTM D1557. A rammer of known mass falls from a fixed height onto a set number of soil layers in a mould of known volume, and the dry density of each specimen is plotted against its water content.
Every embankment, backfill and pavement layer specified as a percentage of a laboratory maximum depends on this test, and so does every field density result checked against it.
The maximum belongs to the energy that produced it, and a compaction result quoted without that energy has no meaning.
What Is the Proctor Compaction Test?
A controlled way of asking how dense a soil can be made with a given effort.
Compaction densifies a soil by expelling air under mechanical energy, unlike consolidation, which expels water slowly under sustained load. Because the water content barely changes, the result is expressed as dry density, which removes the contribution of the water. From the bulk unit weight and water content of each specimen:
γd = γ / ( 1 + w )
where γd is the dry unit weight in kN/m³, γ the bulk unit weight in kN/m³ and w the water content as a decimal.
The standards report dry density, ρd, in Mg/m³, and design uses γd = ρd · g, so 1.90 Mg/m³ corresponds to about 18.6 kN/m³. The relationships between bulk, dry and saturated unit weight follow from the same phase diagram. Laboratory California Bearing Ratio specimens, ASTM D1883, are also prepared from the compaction curve.
How Is the Test Performed?
By compacting the same soil at four or more water contents with identical effort.
ASTM D698 and D1557 each define three methods. Methods A and B use material passing the 4.75 mm and 9.5 mm sieves in a 101.6 mm diameter mould of 944 cm³; Method C uses material passing the 19.0 mm sieve in a 152.4 mm mould of 2124 cm³, which receives 56 blows per layer instead of 25 so that the energy per unit volume stays essentially the same.
Portions of soil are mixed to different water contents, and fine-grained soils are left to stand so the water distributes evenly. Each portion is compacted in layers with the blows spread over the surface, trimmed level with the mould and weighed, and its water content is found by oven drying to ASTM D2216. At least four, preferably five, specimens bracket the optimum, each made from fresh soil, because recompaction crushes particles. The energy per unit volume follows from the geometry:
E = n · N · W · h / V
where E is the compaction energy in kN·m/m³, n the number of layers, N the blows per layer, W the rammer weight in kN, h the drop height in m and V the mould volume in m³.
For the standard test, 3 × 25 × 24.4 N × 0.305 m / 0.000944 m³ gives about 591 kN·m/m³, which the standard rounds to 600 kN·m/m³ (12,400 ft·lbf/ft³).
Standard vs Modified Proctor
The two tests differ only in energy, and that difference is the whole point.
The standard test reflected the compaction plant of the 1930s. As heavier rollers and heavier aircraft arrived, the modified test was developed in the 1940s with a heavier rammer, a higher drop and more layers. BS 1377-4 and EN 13286-2 define comparable light and heavy tests with 2.5 kg and 4.5 kg rammers.
| Parameter | Standard Proctor | Modified Proctor |
|---|---|---|
| Standard | ASTM D698 (AASHTO T 99) | ASTM D1557 (AASHTO T 180) |
| Rammer mass | 2.5 kg (24.4 N) | 4.54 kg (44.5 N) |
| Drop height | 305 mm | 457 mm |
| Number of layers | 3 | 5 |
| Blows per layer | 25 (101.6 mm mould) or 56 (152.4 mm mould) | 25 (101.6 mm mould) or 56 (152.4 mm mould) |
| Nominal energy | ≈ 600 kN·m/m³ | ≈ 2,700 kN·m/m³ |
| Effect on result | Lower maximum dry density, higher optimum moisture | Higher maximum dry density, lower optimum moisture |
The modified energy is about 4.5 times the standard. The curve moves upward and to the left, but the gain in density is far smaller than the gain in energy.
Maximum dry density is not a property of the soil. It is a property of the soil and the compaction energy.
Reading the Compaction Curve
The curve rises on the dry side, peaks and falls on the wet side. Well-graded sands and gravels with some fines give high maxima at low water contents and a sharp peak; high-plasticity clays give low, flat curves with optima at high water contents.
Optimum Moisture Content
On the dry side, suction and friction hold the particles in an open arrangement, and added water softens the contacts so the same blows push them closer together. On the wet side, water fills a growing share of the pores, and since a blow can expel air but not water, extra water only displaces solids. The optimum moisture content, wopt, is the water content at the peak, and the maximum dry density, γd,max, the density there. A higher energy peaks at a lower water content, and the peaks for different energies lie along a line of optimums roughly parallel to the zero air voids line.
The Zero Air Voids Line
For any water content, dry density is bounded by the state in which all air has been expelled:
γd,zav = Gs · γw / ( 1 + w · Gs )
where γd,zav is the zero air voids dry unit weight in kN/m³, Gs the specific gravity of the solids, γw the unit weight of water, 9.81 kN/m³, and w the water content as a decimal.
Replacing w · Gs with w · Gs / S gives the curve for any degree of saturation S. For Gs = 2.70 and w = 14 per cent, the bound is 26.49 / 1.378, about 19.2 kN/m³. Compaction never reaches the line because some air stays trapped. A point on or beyond it is physically impossible and signals an error in density, water content or Gs, which is why a measured specific gravity belongs with a reliable curve.
What Is Relative Compaction?
The ratio that turns a laboratory curve into a field acceptance criterion:
RC = γd,field / γd,max × 100 %
where RC is the relative compaction in per cent, γd,field the dry unit weight measured in the layer and γd,max the maximum dry unit weight from the specified laboratory test.
Specifications commonly call for 95 per cent of the standard maximum, or 90 to 95 per cent of the modified maximum, often with a moisture window around optimum, and higher values beneath pavements and structures, where loose fill adds to foundation settlement. Relative compaction is not relative density, which places a granular soil between its loosest and densest index states.
A worked example shows why the reference must be named. Suppose, for illustration, a fill gives a standard maximum of 18.6 kN/m³ at 13 per cent and a modified maximum of 19.6 kN/m³ at 10.5 per cent. A field test measures a bulk unit weight of 20.5 kN/m³ at 14 per cent, a dry unit weight of 20.5 / 1.14, about 17.98 kN/m³. Against the standard maximum the relative compaction is about 96.7 per cent and the layer passes 95 per cent; against the modified maximum it is about 91.7 per cent and the same layer fails.
How Is Compaction Checked in the Field?
By measuring density and water content in each compacted lift.
| Field method | Principle | Speed | Main limitation |
|---|---|---|---|
| Sand cone (ASTM D1556) | Hole volume from calibrated sand | Slow; water content needs oven drying | Vibration and coarse or collapsing hole walls disturb the sand |
| Nuclear gauge (ASTM D6938) | Gamma transmission for density, neutron moderation for water content | Minutes per test | Water content biased by hydrogen not held as free water; licensed radioactive source |
| Rubber balloon (ASTM D2167) | Hole volume from a water-filled membrane | Slow | Sharp particles puncture the membrane; unsuitable in soft soils |
| Drive cylinder (ASTM D2937) | Volume of a cylinder driven into the soil | Moderate | Fine-grained soils without gravel only; driving can densify the sample |
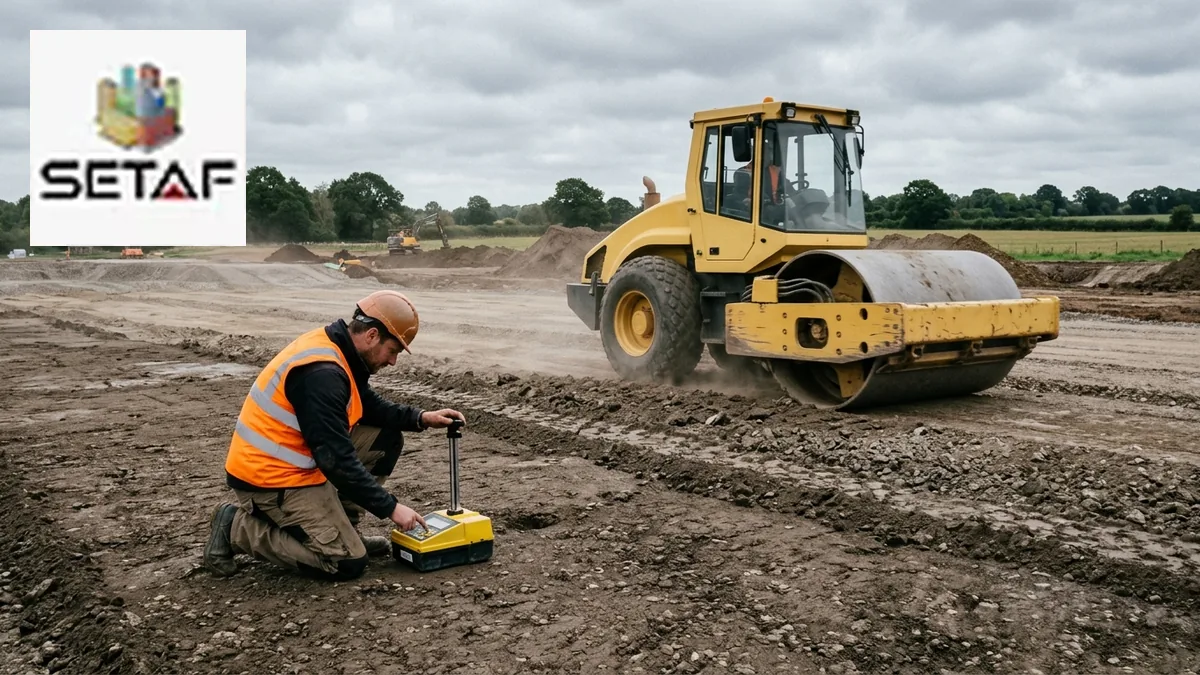
The nuclear gauge is fast but reads all hydrogen as water, including hydrogen in organic matter and water bound to clay minerals, so its results are checked against oven-dried samples and sand cone tests at the start of a job and whenever the material changes. The geotechnical report that sets the requirement should state the reference test, the percentage and the moisture window together.
Dry of Optimum vs Wet of Optimum: Same Density, Different Soil
The same dry density can be reached on either side of the peak, and in fine-grained soils the two fills behave differently.
Lambe (1958) attributed the difference to structure: clay compacted dry of optimum is flocculated, with edge-to-face contacts and larger pores, while clay compacted wet of optimum is more dispersed. Mitchell, Hooper and Campanella (1965) found that permeability falls sharply as the placement water content passes optimum, and wet-side specimens can be an order of magnitude or more less permeable than dry-side specimens of the same density. For this reason Daniel and Benson (1990) defined acceptable zones for clay liners by water content and density together.
Strength and volume change point the other way. Dry-side fill is stiffer and stronger as compacted but brittle, and on later wetting it can swell if the clay is active or collapse if the structure is open. Wet-side fill is softer and more ductile, deforms without cracking and shrinks more if it dries, which is why earth dam cores have traditionally been placed slightly wet of optimum.
Density is not what the specification is really after. It is a proxy for strength, stiffness and permeability, and the placement water content decides which of them the fill delivers.
Why Does the Laboratory Maximum Not Match the Field?
Because the laboratory and the roller apply different energies to slightly different materials.
A heavy vibratory roller can deliver more effort than the standard test, while the effort reaching the bottom of a thick lift can fall below it. The laboratory test also removes particles coarser than the sieve of the method, and gravel denser than the matrix it replaces raises the field density of the whole material. ASTM D4718 corrects for this from the proportion and specific gravity of the oversize fraction, with decreasing reliability as that fraction grows.
Borrow material also varies, and one reference curve applied to a changing material shifts the relative compaction with no change in compaction quality. A family of curves with a one-point check, as in AASHTO T 272, or a new reference test when the material changes addresses this. Errors in Gs or in gauge calibration add a further shift.
A relative compaction above 100 per cent is not a success. It is a sign that the reference no longer describes the fill.
When Is the Proctor Test Not Appropriate?
Where the soil does not respond to impact compaction as the test assumes.
Clean, free-draining sands and gravels often give no clear peak: water drains from the mould, and at low water contents capillary suction holds the grains apart, a phenomenon known as bulking, so the highest densities may occur dry or saturated. Their compaction is controlled by relative density, using the maximum index density from a vibratory table, ASTM D4253, and the minimum index density, ASTM D4254, intended for soils with no more than about 15 per cent fines.
Rockfill is too coarse for any mould and is specified by method, through lift thickness, plant and passes, verified on trial embankments. Weak rocks and shales break down under the rammer. Compaction also treats only placed fill and the near surface; soft ground at depth calls for methods such as deep soil mixing.
Common Errors in Compaction Control
| Error | Consequence |
|---|---|
| Specification does not state standard or modified Proctor | Pass or fail decided by the reference, not by the fill |
| Reference curve from a different borrow material | Relative compaction shifts with no change in compaction quality |
| Oversize particles ignored in the field result | Field density above the laboratory maximum; false passes |
| Specific gravity assumed rather than measured | Zero air voids line misplaced; impossible points go unnoticed |
| Density checked and water content ignored | Correct density on the wrong side of optimum; swell, collapse or leakage |
| Nuclear gauge water content not checked against oven drying | Systematic error in dry density and relative compaction |
| Proctor test used on clean, free-draining sand | Poorly defined maximum; loose sand accepted |
Where SETAF2018 Fits
SETAF2018 treats compaction data as part of the material definition rather than as a separate laboratory calculation. In the Mechanical Properties tab of each material, the Compaction Properties group holds the optimum moisture content, wopt, and the maximum dry unit weight in compaction, γdmax, and the same tab provides a field for the California Bearing Ratio.
These are stored values, not processed test results. The program does not take the individual Proctor points or draw the compaction curve; the moisture and density pairs and the choice of energy remain in the laboratory record, and the values entered are those the laboratory reports. The laboratory testing module processes the consolidation test, and the compaction test is not among its procedures.
A compacted fill can be defined as a material of its own, separate from the natural ground beneath it. Depending on the material assignment option chosen in the program settings, it is either tied to a borehole and a depth range or assigned to a layer when the soil profile is built. In the Physical Properties tab, the Calculate button derives the void ratio, the degree of saturation and the dry, saturated and submerged unit weights from the entered parameters.
Field compaction control sits outside the program. There is no module for sand cone or nuclear gauge results, and relative compaction is not calculated, so the earthworks record remains the place for acceptance testing and for naming the test behind γdmax.
Because the fill is a material in the same model, its unit weights and strength parameters enter every analysis that uses that layer, and the local report shows those calculations with their equations. A fill defined once is carried into the foundation, excavation support and slope checks built on the shared soil profile.
Frequently Asked Questions
What is the Proctor compaction test?
It is a laboratory test that compacts soil at several water contents with a fixed energy, using a falling rammer in a mould of known volume, to find the maximum dry density and the optimum moisture content. These two values are the reference for specifying and accepting compacted fill.
What is the difference between standard and modified Proctor?
The energy. Standard Proctor, ASTM D698, drops a 2.5 kg rammer 305 mm onto three layers, about 600 kN·m/m³; modified Proctor, ASTM D1557, drops a 4.54 kg rammer 457 mm onto five layers, about 2,700 kN·m/m³. The modified test gives a higher maximum dry density at a lower optimum moisture content.
What is optimum moisture content?
It is the water content at which a given compaction energy produces the highest dry density. Below it, suction and friction resist particle rearrangement; above it, water fills voids that the blows cannot empty. Because it depends on the energy, standard and modified tests give different optima for the same soil.
What is the zero air voids line?
It is the curve of dry density against water content for a soil whose pores contain no air, calculated as γd = Gs · γw / ( 1 + w · Gs ). Compaction cannot reach it, so a test point that plots on or beyond the line indicates an error in density, water content or specific gravity.
What does 95 percent relative compaction mean?
It means the field dry density equals 95 per cent of the maximum dry density from the specified laboratory Proctor test. Measured against modified Proctor it is a much stricter requirement than against standard Proctor, so the figure has meaning only when the reference test is named in the specification.
Why is compacting wet of optimum different from dry of optimum?
Because the same density can hold two different structures. Lambe (1958) described clay compacted dry of optimum as flocculated and wet of optimum as dispersed. Dry-side fill is stiffer and stronger as compacted but may swell or collapse on wetting; wet-side fill is softer, more ductile and less permeable, which is why clay liners are compacted wet.
Can the Proctor test be used for clean sand?
Not reliably. Clean, free-draining sands often show no clear peak, because water drains during compaction and capillary suction at low water contents lowers the density. Their compaction is controlled by relative density instead, using the maximum and minimum index densities of ASTM D4253 and ASTM D4254.
Why does field density sometimes exceed the laboratory maximum?
Usually because the reference no longer represents the fill or the effort. Heavy rollers can exceed the laboratory energy, gravel removed before the laboratory test raises field density, and borrow material changes. Such results call for an oversize correction to ASTM D4718, a new reference curve or a gauge check.